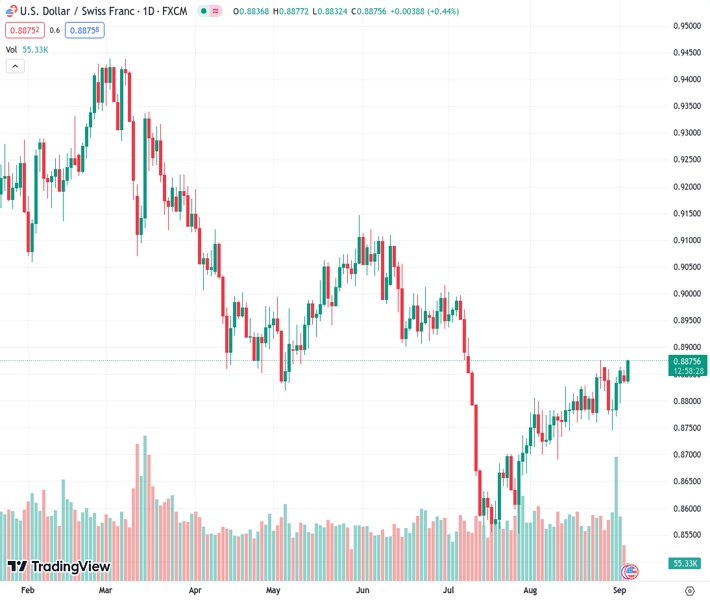
The USD/CHF currency pair remains stable above the 0.8850 level due to the US Dollar’s rebound.
…
This is a premium post.
[s2If !current_user_can(access_s2member_level4)]Please register for FREE REGISTER to read full post below containing analysis. In case of any error or you think you are not able to read the full post below, please email us at support#nehcap.com [lwa][/s2If] [s2If current_user_can(access_s2member_level1)]
- USD/CHF holds ground above 0.8850 on the back of recovery in the Greenback.
The pair currently trades last at 0.88748.
The previous day high was 0.8862 while the previous day low was 0.8833. The daily 38.2% Fib levels comes at 0.8844, expected to provide support. Similarly, the daily 61.8% fib level is at 0.8851, expected to provide support.
USD/CHF snaps the previous day’s losses, trading higher around 0.8870 during the early trading hours in the European session on Tuesday. The pair experiences upward support due to the firmer US Dollar (USD) and Swiss downbeat Gross Domestic Product (GDP) for the second quarter (Q2) of 2023.
As said, the Swiss GDP reduced to 0.0% against the market consensus of 0.1%, which was recorded at 0.3% in the previous quarter. Additionally, the Greenback strengthens as investors appear to accept the potential nearing end of the interest rate-hike cycle by the US Federal Reserve (Fed).
The Moving Average Convergence Divergence (MACD) line remains above the centerline and the signal line, which indicates that recent momentum is stronger.
The pair could face a challenge around August’s high at 0.8876 level, followed by the 0.8900 psychological level.
On the flip side, the 21-day Exponential Moving Average (EMA) at 0.8807 could act as the immediate support, lined up with the 0.8800 psychological level and 23.6% Fibonacci retracement at 0.8799.
A firm break below the latter could open the doors for the USD/CHF pair to navigate the area around the 0.8750 psychological level.
In the short term, the USD/CHF pair remains to be bullish as long as the 14-day Relative Strength Index (RSI) stays above 50.
Technical Levels: Supports and Resistances
USDCHF currently trading at 0.887 at the time of writing. Pair opened at 0.8844 and is trading with a change of 0.29 % .
| Overview | Overview.1 | |
|---|---|---|
| 0 | Today last price | 0.8870 |
| 1 | Today Daily Change | 0.0026 |
| 2 | Today Daily Change % | 0.2900 |
| 3 | Today daily open | 0.8844 |
The pair is trading above its 20 Daily moving average @ 0.8802, above its 50 Daily moving average @ 0.8781 , below its 100 Daily moving average @ 0.888 and below its 200 Daily moving average @ 0.9064
| Trends | Trends.1 | |
|---|---|---|
| 0 | Daily SMA20 | 0.8802 |
| 1 | Daily SMA50 | 0.8781 |
| 2 | Daily SMA100 | 0.8880 |
| 3 | Daily SMA200 | 0.9064 |
The previous day high was 0.8862 while the previous day low was 0.8833. The daily 38.2% Fib levels comes at 0.8844, expected to provide support. Similarly, the daily 61.8% fib level is at 0.8851, expected to provide support.
Note the levels of interest below:
- Pivot support is noted at 0.883, 0.8817, 0.8801
- Pivot resistance is noted at 0.886, 0.8876, 0.8889
| Levels | Levels.1 |
|---|---|
| Previous Daily High | 0.8862 |
| Previous Daily Low | 0.8833 |
| Previous Weekly High | 0.8865 |
| Previous Weekly Low | 0.8745 |
| Previous Monthly High | 0.8876 |
| Previous Monthly Low | 0.8690 |
| Daily Fibonacci 38.2% | 0.8844 |
| Daily Fibonacci 61.8% | 0.8851 |
| Daily Pivot Point S1 | 0.8830 |
| Daily Pivot Point S2 | 0.8817 |
| Daily Pivot Point S3 | 0.8801 |
| Daily Pivot Point R1 | 0.8860 |
| Daily Pivot Point R2 | 0.8876 |
| Daily Pivot Point R3 | 0.8889 |
[/s2If]
Download Nehcap EAWe have two EAs that are operational on our LIVE accounts.
- EA-FIX: Check out the details here. Download EA-FIX . EA-FIX is a non-grid HFT scalper.
- EA-GROWTH: High quality low dd EA using trend grids. Download EA_GROWTHJoin Our Telegram Group
")


