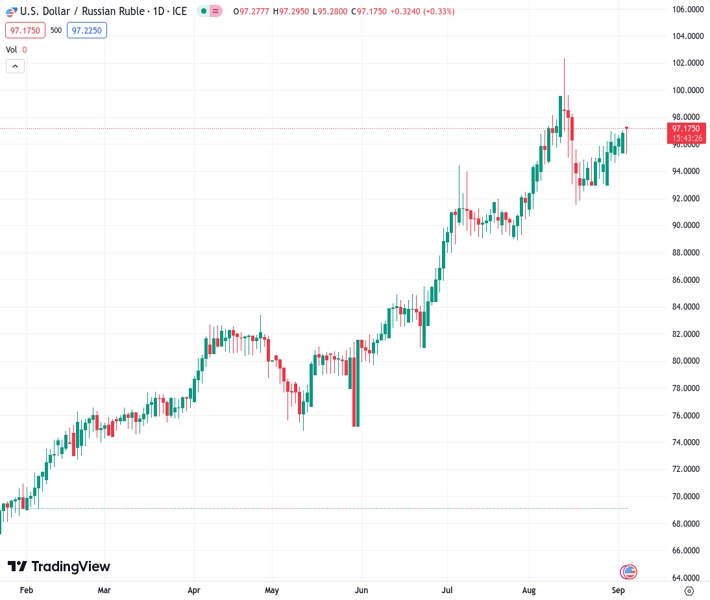
The US dollar to Russian ruble pair, trading at 97.2200, continues its upward movement beyond the 97.00 level.
…
This is a premium post.
[s2If !current_user_can(access_s2member_level4)]Please register for FREE REGISTER to read full post below containing analysis. In case of any error or you think you are not able to read the full post below, please email us at support#nehcap.com [lwa][/s2If] [s2If current_user_can(access_s2member_level1)]
- USD/RUB extends its upside above the 97.00 mark.
The pair currently trades last at 97.2200.
The previous day high was 97.0765 while the previous day low was 96.158. The daily 38.2% Fib levels comes at 96.7256, expected to provide support. Similarly, the daily 61.8% fib level is at 96.5089, expected to provide support.
USD/RUB gains momentum and trades in positive territory for the third consecutive week during the early European session on Monday. The pair currently trades near 97.23, up 0.37% for the day.
The economic data released last week revealed that Russia’s S&P Global Manufacturing PMI for August came in at 52.7 compared to the market estimate of 52.1. The figure rose to its highest level in three months. The Unemployment Rate for July declined to a new all-time low of 3.0% from 3.1% in June and the 3.2% market expectation.
The Russian Ruble has been falling sharply in recent months and Russia’s budget is under pressure as a result of the Ukraine conflict. The Bank of Russia increased the interest rate by 350 basis points (bps) to reach 12% on August 15 to stop the depreciation of the Ruble. Apart from this, Russia has increased its military spending objective for 2023 to more than $100 billion, representing a third of all state expenditure, as the escalating costs of the Ukraine conflict place an increasing strain on Moscow’s finances.
Nonetheless, Russian Finance Minister Anton Siluanov forecasts that the Russian economy will expand by at least 2.5% in 2023, with inflation hovering around 6%. He also said that he will collaborate with the Central Bank to take all necessary steps to bring down inflation to a sustainable level.
On the US Dollar docket, Market players speculate on a less aggressive Federal Reserve (Fed) stance following the mixed economic data results last week. The possibility of holding an interest rate at the September meeting remains at 93%, according to the CME FedWatch Tool. Meanwhile, the odds of hiking rates at the November meeting are about 38%. That said, Fed Chairman Jerome Powell stated at the Jackson Hole Symposium that a potential additional rate hike would be depending on incoming data.
Looking ahead, market participants will focus on the US Factory Orders due later on Tuesday and then shift their focus to the US ISM Services PMI data on Wednesday. These figures could give a clear direction for USD/RUB. Also, the headline surrounding Russia’s war in Ukraine remains in focus.
Technical Levels: Supports and Resistances
USDRUB currently trading at 60.95 at the time of writing. Pair opened at 96.875 and is trading with a change of -37.08 % .
| Overview | Overview.1 | |
|---|---|---|
| 0 | Today last price | 60.950 |
| 1 | Today Daily Change | -35.925 |
| 2 | Today Daily Change % | -37.080 |
| 3 | Today daily open | 96.875 |
The pair remains strongly bearish on the daily time frame. It trades below the 20 SMA @ 95.9618, 50 SMA 92.8635, 100 SMA @ 86.9531 and 200 SMA @ 79.765.
| Trends | Trends.1 | |
|---|---|---|
| 0 | Daily SMA20 | 95.9618 |
| 1 | Daily SMA50 | 92.8635 |
| 2 | Daily SMA100 | 86.9531 |
| 3 | Daily SMA200 | 79.7650 |
The previous day high was 97.0765 while the previous day low was 96.158. The daily 38.2% Fib levels comes at 96.7256, expected to provide support. Similarly, the daily 61.8% fib level is at 96.5089, expected to provide support.
Note the levels of interest below:
- Pivot support is noted at 96.3298, 95.7847, 95.4113
- Pivot resistance is noted at 97.2483, 97.6217, 98.1668
| Levels | Levels.1 |
|---|---|
| Previous Daily High | 97.0765 |
| Previous Daily Low | 96.1580 |
| Previous Weekly High | 97.0570 |
| Previous Weekly Low | 93.3715 |
| Previous Monthly High | 102.3800 |
| Previous Monthly Low | 90.8215 |
| Daily Fibonacci 38.2% | 96.7256 |
| Daily Fibonacci 61.8% | 96.5089 |
| Daily Pivot Point S1 | 96.3298 |
| Daily Pivot Point S2 | 95.7847 |
| Daily Pivot Point S3 | 95.4113 |
| Daily Pivot Point R1 | 97.2483 |
| Daily Pivot Point R2 | 97.6217 |
| Daily Pivot Point R3 | 98.1668 |
[/s2If]
Download Nehcap EAWe have two EAs that are operational on our LIVE accounts.
- EA-FIX: Check out the details here. Download EA-FIX . EA-FIX is a non-grid HFT scalper.
- EA-GROWTH: High quality low dd EA using trend grids. Download EA_GROWTHJoin Our Telegram Group
")


