The US dollar to Mexican peso exchange rate, represented as USDMXN at 17.2672, experiences a continuous increase for the fourth day in a row on Tuesday.
…
This is a premium post.
[s2If !current_user_can(access_s2member_level4)]Please register for FREE REGISTER to read full post below containing analysis. In case of any error or you think you are not able to read the full post below, please email us at support#nehcap.com [lwa][/s2If] [s2If current_user_can(access_s2member_level1)]
- USD/MXN gains traction for the fourth consecutive day on Tuesday.
The pair currently trades last at 17.2672.
The previous day high was 17.1948 while the previous day low was 17.0447. The daily 38.2% Fib levels comes at 17.1375, expected to provide support. Similarly, the daily 61.8% fib level is at 17.1021, expected to provide support.
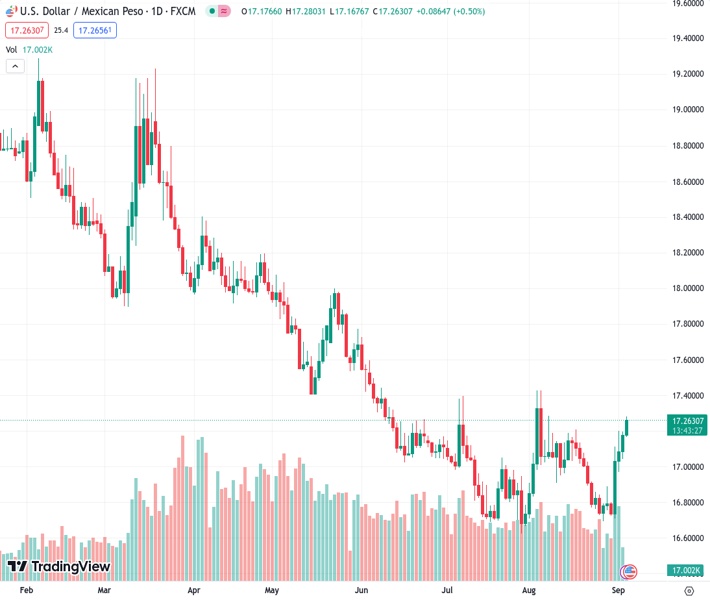
The Mexican Peso (MXN) extends its downside against the US Dollar (USD) during the early European session on Tuesday as the Bank of Mexico will reduce its currency hedging program to tame volatility in the market. USD/MXN currently trades near 17.25, gaining 0.45% on the day.
According to the daily chart, USD/MXN holds below the key 100-day Exponential Moving Average (EMA) which means further downside looks favorable. Therefore, the pair could meet the immediate resistance level of the 17.30-17.35 region, representing the upper boundary of the Bollinger Band and the 100-day EMA. The additional upside filter to watch is near a psychological round mark and a high of May 24 at 18.00. Further north, the next barrier is seen at 18.20 (a high of April 27) and finally at 18.40 (a high of April 5).
On the flip side, the initial support level is located at the 17.00-17.05 region. The mentioned level is a confluence of the midline of Bollinger Band, a psychological round figure, and the 50-day EMA. Any extended weakness below the latter will challenge the critical contention at the 16.60-16.70 region, portraying the lower limit of the Bollinger Band and a Year-To-Date (YTD) low. Further south, the pair will see a drop to a psychological round figure at 16.00.
It’s worth noting that the Relative Strength Index (RSI) stands above 50, within bullish territory, suggesting that buyers will likely retain control soon.
Technical Levels: Supports and Resistances
USDMXN currently trading at 17.2497 at the time of writing. Pair opened at 17.1772 and is trading with a change of 0.42 % .
| Overview | Overview.1 | |
|---|---|---|
| 0 | Today last price | 17.2497 |
| 1 | Today Daily Change | 0.0725 |
| 2 | Today Daily Change % | 0.4200 |
| 3 | Today daily open | 17.1772 |
The pair is trading above its 20 Daily moving average @ 16.9872, above its 50 Daily moving average @ 16.9729 , below its 100 Daily moving average @ 17.2964 and below its 200 Daily moving average @ 18.0541
| Trends | Trends.1 | |
|---|---|---|
| 0 | Daily SMA20 | 16.9872 |
| 1 | Daily SMA50 | 16.9729 |
| 2 | Daily SMA100 | 17.2964 |
| 3 | Daily SMA200 | 18.0541 |
The previous day high was 17.1948 while the previous day low was 17.0447. The daily 38.2% Fib levels comes at 17.1375, expected to provide support. Similarly, the daily 61.8% fib level is at 17.1021, expected to provide support.
Note the levels of interest below:
- Pivot support is noted at 17.0831, 16.9889, 16.933
- Pivot resistance is noted at 17.2331, 17.289, 17.3832
| Levels | Levels.1 |
|---|---|
| Previous Daily High | 17.1948 |
| Previous Daily Low | 17.0447 |
| Previous Weekly High | 17.2025 |
| Previous Weekly Low | 16.6945 |
| Previous Monthly High | 17.4274 |
| Previous Monthly Low | 16.6945 |
| Daily Fibonacci 38.2% | 17.1375 |
| Daily Fibonacci 61.8% | 17.1021 |
| Daily Pivot Point S1 | 17.0831 |
| Daily Pivot Point S2 | 16.9889 |
| Daily Pivot Point S3 | 16.9330 |
| Daily Pivot Point R1 | 17.2331 |
| Daily Pivot Point R2 | 17.2890 |
| Daily Pivot Point R3 | 17.3832 |
[/s2If]
Download Nehcap EAWe have two EAs that are operational on our LIVE accounts.
- EA-FIX: Check out the details here. Download EA-FIX . EA-FIX is a non-grid HFT scalper.
- EA-GROWTH: High quality low dd EA using trend grids. Download EA_GROWTHJoin Our Telegram Group
")


