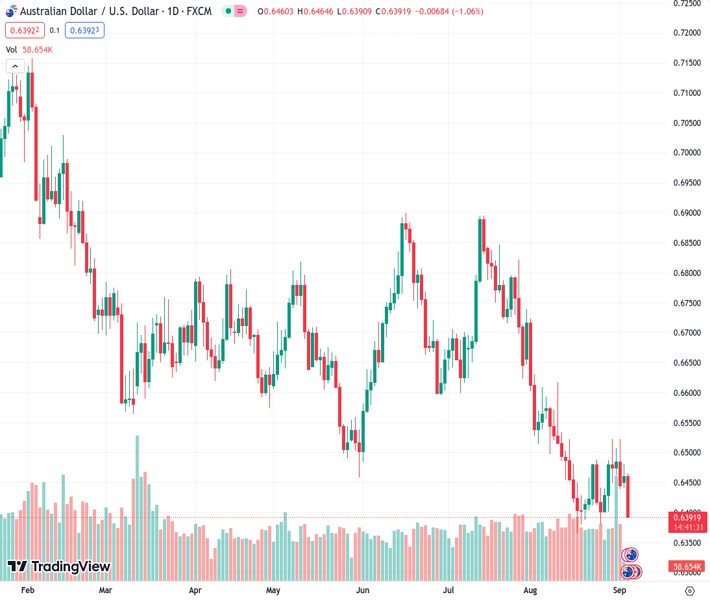
The AUDUSD currency pair, currently trading at 0.63948, is experiencing selling pressure, leading to a new low for the week and testing an important short-term support level. According to the view of @nehcap, there is not much expected to further decline in the near future.
…
This is a premium post.
[s2If !current_user_can(access_s2member_level4)]Please register for FREE REGISTER to read full post below containing analysis. In case of any error or you think you are not able to read the full post below, please email us at support#nehcap.com [lwa][/s2If] [s2If current_user_can(access_s2member_level1)]
- AUD/USD takes offers to refresh weekly low, prods short-term key support line.
The pair currently trades last at 0.63948.
The previous day high was 0.648 while the previous day low was 0.6445. The daily 38.2% Fib levels comes at 0.6467, expected to provide resistance. Similarly, the daily 61.8% fib level is at 0.6458, expected to provide resistance.
11-month-old rising support line, below-50.0 RSI will test sellers during further dominance.
AUD/USD stands on slippery grounds as it refreshes the weekly low around 0.6395 during early Tuesday in Europe. In doing so, the Aussie pair justifies the Reserve Bank of Australia’s (RBA) inaction, as well as a cautious view about the economic growth and inflation conditions.
Technically, the risk barometer pair extends the early-day break of the 10-DMA as sellers attack a two-week-long rising support line.
It’s worth noting that the quote’s inability to cross the levels marked in late May and early June, around 0.6500 joins the looming bear cross on the MACD to also keep the AUD/USD sellers hopeful of breaking the immediate support line surrounding 0.6400.
However, the below-50.0 levels of the RSI (14) line suggest bottom-picking of the Aussie pair and hence highlights an upward-sloping support line from October 2022, close to 0.6370 at the latest, as an important support to watch. Also acting as the downside filter is the previous monthly low of around 0.6365.
Alternatively, a daily closing beyond the 10-DMA hurdle of around 0.6450 isn’t an open invitation to the AUD/USD buyers as a descending resistance line from July 13 surrounding 0.6480 challenges the pair’s immediate upside.
Following that, the aforementioned resistance area comprising levels marked in May–June, around 0.6500, will be in the spotlight.
Overall, the AUD/USD pair is likely to decline further but the downside appears limited as the key support line holds.
Trend: Limited downside expected
Technical Levels: Supports and Resistances
AUDUSD currently trading at 0.64 at the time of writing. Pair opened at 0.6462 and is trading with a change of -0.96% % .
| Overview | Overview.1 | |
|---|---|---|
| 0 | Today last price | 0.64 |
| 1 | Today Daily Change | -0.0062 |
| 2 | Today Daily Change % | -0.96% |
| 3 | Today daily open | 0.6462 |
The pair remains strongly bearish on the daily time frame. It trades below the 20 SMA @ 0.6459, 50 SMA 0.6602, 100 SMA @ 0.6641 and 200 SMA @ 0.672.
| Trends | Trends.1 | |
|---|---|---|
| 0 | Daily SMA20 | 0.6459 |
| 1 | Daily SMA50 | 0.6602 |
| 2 | Daily SMA100 | 0.6641 |
| 3 | Daily SMA200 | 0.6720 |
The previous day high was 0.648 while the previous day low was 0.6445. The daily 38.2% Fib levels comes at 0.6467, expected to provide resistance. Similarly, the daily 61.8% fib level is at 0.6458, expected to provide resistance.
Note the levels of interest below:
- Pivot support is noted at 0.6444, 0.6427, 0.6409
- Pivot resistance is noted at 0.648, 0.6498, 0.6515
| Levels | Levels.1 |
|---|---|
| Previous Daily High | 0.6480 |
| Previous Daily Low | 0.6445 |
| Previous Weekly High | 0.6522 |
| Previous Weekly Low | 0.6401 |
| Previous Monthly High | 0.6724 |
| Previous Monthly Low | 0.6364 |
| Daily Fibonacci 38.2% | 0.6467 |
| Daily Fibonacci 61.8% | 0.6458 |
| Daily Pivot Point S1 | 0.6444 |
| Daily Pivot Point S2 | 0.6427 |
| Daily Pivot Point S3 | 0.6409 |
| Daily Pivot Point R1 | 0.6480 |
| Daily Pivot Point R2 | 0.6498 |
| Daily Pivot Point R3 | 0.6515 |
[/s2If]
Download Nehcap EAWe have two EAs that are operational on our LIVE accounts.
- EA-FIX: Check out the details here. Download EA-FIX . EA-FIX is a non-grid HFT scalper.
- EA-GROWTH: High quality low dd EA using trend grids. Download EA_GROWTHJoin Our Telegram Group
")


