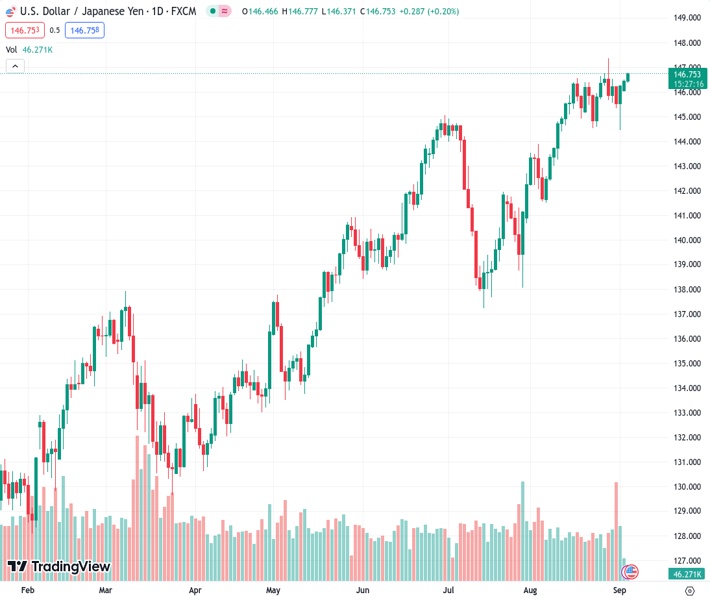
On Tuesday, the USDJPY currency pair is trading above 146.752, experiencing a positive trend for the third day in a row.
…
This is a premium post.
[s2If !current_user_can(access_s2member_level4)]Please register for FREE REGISTER to read full post below containing analysis. In case of any error or you think you are not able to read the full post below, please email us at support#nehcap.com [lwa][/s2If] [s2If current_user_can(access_s2member_level1)]
- USD/JPY trades in positive territory for the third consecutive day on Tuesday.
The pair currently trades last at 146.752.
The previous day high was 146.5 while the previous day low was 146.02. The daily 38.2% Fib levels comes at 146.32, expected to provide support. Similarly, the daily 61.8% fib level is at 146.21, expected to provide support.
The USD/JPY pair extends its upside above the mid-146.00s during the early European session on Tuesday. The major pair currently trades near 146.72, gaining 0.16% on the day.
Japanese household expenditure suffered its largest decline in nearly two and a half years. According to the most recent data released on Tuesday, Japanese Household Spending fell 5.0% year on year in July, below the market expectation of a 2.5% drop. This figure indicated the sixth straight month of decline. Earlier, the Japanese Monetary Base data for August revealed a rise of 1.2% YoY compared to the previous reading of a 1.3% drop.
It is worth mentioning that the Bank of Japan (BOJ) maintains its loose monetary policy while shifting away from yield curve control. BoJ Board member Toyoaki Nakamura said last week that policymakers need more time to move to monetary tightening. However, the monetary policy divergence between the US and Japan may limit the USD/JPY pair’s downside for the time being.
Furthermore, Japanese Finance Minister Shunichi Suzuki stated last week that although sudden fluctuations in currencies are undesirable, there is no visible indication of intervention in the market to shore up the weak yen. However, the policymaker will closely watch the currency move.
Following last week’s mixed economic data results, market participants place bets on the Federal Reserve (Fed) taking a less aggressive posture. According to the CME FedWatch Tool, the possibility of keeping interest rates at the September meeting remains at 93%, while the odds of hiking rates at the November meeting are about 38%.
About US data last week, August’s Nonfarm Payrolls (NFP) came in at 187K, better than market expectations of 170K and the previous reading of 157K. Nevertheless, the Unemployment Rate fell substantially to 3.8%, compared to the market consensus and the previous rate of 3.5%. The US Manufacturing PMI came in at 47.6 versus 46.4 previously and exceeded expectations of 47.0. The upside of the Greenback seems limited as Wall Street is closed today in observance of Labor Day.
Market players will keep an eye on the US Factory Orders due later in the day. The attention will shift to the US ISM Services PMI on Wednesday. On Friday, the Japanese Gross Domestic Product (GDP) for Q2 will be released. The quarterly growth number is expected to grow by 1.3%. Traders will find the trading opportunity around the USD/JPY pair.
Technical Levels: Supports and Resistances
USDJPY currently trading at 146.75 at the time of writing. Pair opened at 146.49 and is trading with a change of 0.18 % .
| Overview | Overview.1 | |
|---|---|---|
| 0 | Today last price | 146.75 |
| 1 | Today Daily Change | 0.26 |
| 2 | Today Daily Change % | 0.18 |
| 3 | Today daily open | 146.49 |
The pair remains strongly bullish on the daily timeframe. It trades above its 20 SMA @ 145.58, 50 SMA 143.29, 100 SMA @ 140.64 and 200 SMA @ 136.87.
| Trends | Trends.1 | |
|---|---|---|
| 0 | Daily SMA20 | 145.58 |
| 1 | Daily SMA50 | 143.29 |
| 2 | Daily SMA100 | 140.64 |
| 3 | Daily SMA200 | 136.87 |
The previous day high was 146.5 while the previous day low was 146.02. The daily 38.2% Fib levels comes at 146.32, expected to provide support. Similarly, the daily 61.8% fib level is at 146.21, expected to provide support.
Note the levels of interest below:
- Pivot support is noted at 146.18, 145.86, 145.7
- Pivot resistance is noted at 146.65, 146.81, 147.12
| Levels | Levels.1 |
|---|---|
| Previous Daily High | 146.50 |
| Previous Daily Low | 146.02 |
| Previous Weekly High | 147.38 |
| Previous Weekly Low | 144.44 |
| Previous Monthly High | 147.38 |
| Previous Monthly Low | 141.51 |
| Daily Fibonacci 38.2% | 146.32 |
| Daily Fibonacci 61.8% | 146.21 |
| Daily Pivot Point S1 | 146.18 |
| Daily Pivot Point S2 | 145.86 |
| Daily Pivot Point S3 | 145.70 |
| Daily Pivot Point R1 | 146.65 |
| Daily Pivot Point R2 | 146.81 |
| Daily Pivot Point R3 | 147.12 |
[/s2If]
Download Nehcap EAWe have two EAs that are operational on our LIVE accounts.
- EA-FIX: Check out the details here. Download EA-FIX . EA-FIX is a non-grid HFT scalper.
- EA-GROWTH: High quality low dd EA using trend grids. Download EA_GROWTHJoin Our Telegram Group
")


