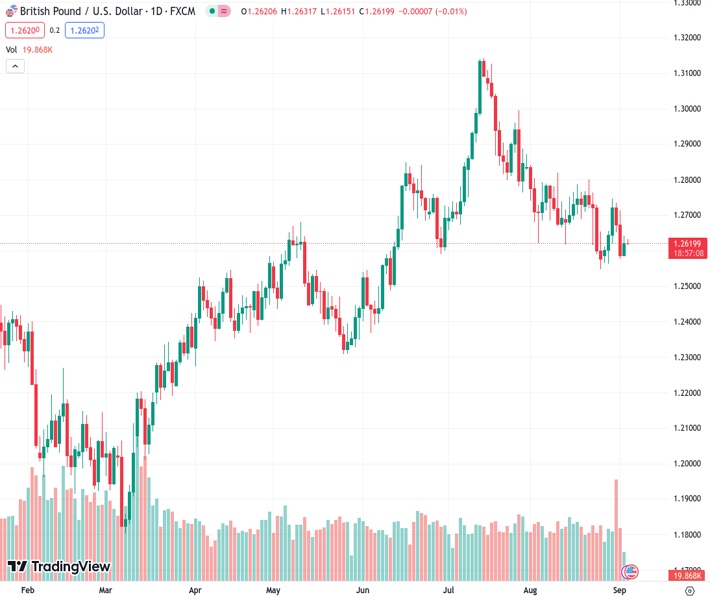
During the early Asian session on Tuesday, the GBP/USD currency pair remains stagnant at a range between 1.2622 and 1.2630, with no significant movement.
…
This is a premium post.
[s2If !current_user_can(access_s2member_level4)]Please register for FREE REGISTER to read full post below containing analysis. In case of any error or you think you are not able to read the full post below, please email us at support#nehcap.com [lwa][/s2If] [s2If current_user_can(access_s2member_level1)]
- GBP/USD flat-lines in a 1.2622-1.2630 range in the early Asian session on Tuesday.
The pair currently trades last at 1.26209.
The previous day high was 1.2643 while the previous day low was 1.2587. The daily 38.2% Fib levels comes at 1.2621, expected to provide resistance. Similarly, the daily 61.8% fib level is at 1.2608, expected to provide support.
The GBP/USD pair oscillates in a narrow range above the 1.2600 mark during the early Monday’s Asian session. The major pair currently trades near 1.2628, gaining 0.01% on the day.
Traders anticipate that the Bank of England (BoE) is likely to raise 25 basis points (bps) in the upcoming meeting. The BoE Chief Economist Huw Pill noted last week that inflation in the UK remained too high and that many measures are in place. BoE’s aggressive tightening of monetary policy might put some pressure on the British Pound (GBP) since investors are concerned about the effect on the UK economy.
The data released last week revealed that August was the weakest month for British factories since the beginning of the COVID-19 crisis. The S&P Global/CIPS Manufacturing PMI came in at 43.0 In August from 45.3 in July. The figure marked the six consecutive months below the 50 threshold.
Across the pond, market players bet on the less hawkish stance of the Federal Reserve (Fed) following the mixed economic data results last week. The odds of holding the interest rate at the September meeting remain at 93%, while the probability of raising rates in its November meeting is around 38%, according to the CME FedWatch Tool.
About US data last week, August’s Nonfarm Payrolls (NFP) came in at 187K, better than market expectations of 170K and the previous reading of 157K. Nevertheless, the Unemployment Rate fell substantially to 3.8%, compared to the market consensus and the previous rate of 3.5%. The US Manufacturing PMI came in at 47.6 versus 46.4 previously and exceeded expectations of 47.0. The upside of the Greenback seems limited as Wall Street is closed today in observance of Labor Day.
Moving on, market participants will take cues from the UK S&P Global/CIPS Composite PMI and Services PMI for August due later on Tuesday ahead of the US Factory Orders in the North American session. The attention will shift to the US ISM Services PMI on Wednesday. The figure is expected to rise to 52.6. Traders will find the trading opportunity around the GBP/USD pair.
Technical Levels: Supports and Resistances
GBPUSD currently trading at 1.2631 at the time of writing. Pair opened at 1.2626 and is trading with a change of 0.04 % .
| Overview | Overview.1 | |
|---|---|---|
| 0 | Today last price | 1.2631 |
| 1 | Today Daily Change | 0.0005 |
| 2 | Today Daily Change % | 0.0400 |
| 3 | Today daily open | 1.2626 |
The pair is trading below its 20 Daily moving average @ 1.2685, below its 50 Daily moving average @ 1.2775 , below its 100 Daily moving average @ 1.2652 and above its 200 Daily moving average @ 1.2419
| Trends | Trends.1 | |
|---|---|---|
| 0 | Daily SMA20 | 1.2685 |
| 1 | Daily SMA50 | 1.2775 |
| 2 | Daily SMA100 | 1.2652 |
| 3 | Daily SMA200 | 1.2419 |
The previous day high was 1.2643 while the previous day low was 1.2587. The daily 38.2% Fib levels comes at 1.2621, expected to provide resistance. Similarly, the daily 61.8% fib level is at 1.2608, expected to provide support.
Note the levels of interest below:
- Pivot support is noted at 1.2595, 1.2563, 1.2539
- Pivot resistance is noted at 1.265, 1.2674, 1.2706
| Levels | Levels.1 |
|---|---|
| Previous Daily High | 1.2643 |
| Previous Daily Low | 1.2587 |
| Previous Weekly High | 1.2746 |
| Previous Weekly Low | 1.2563 |
| Previous Monthly High | 1.2841 |
| Previous Monthly Low | 1.2548 |
| Daily Fibonacci 38.2% | 1.2621 |
| Daily Fibonacci 61.8% | 1.2608 |
| Daily Pivot Point S1 | 1.2595 |
| Daily Pivot Point S2 | 1.2563 |
| Daily Pivot Point S3 | 1.2539 |
| Daily Pivot Point R1 | 1.2650 |
| Daily Pivot Point R2 | 1.2674 |
| Daily Pivot Point R3 | 1.2706 |
[/s2If]
Download Nehcap EAWe have two EAs that are operational on our LIVE accounts.
- EA-FIX: Check out the details here. Download EA-FIX . EA-FIX is a non-grid HFT scalper.
- EA-GROWTH: High quality low dd EA using trend grids. Download EA_GROWTHJoin Our Telegram Group
")


