Aggressive selling is triggered around AUDUSD at a rate of 0.63768 on Tuesday due to a variety of factors.
…
This is a premium post.
[s2If !current_user_can(access_s2member_level4)]Please register for FREE REGISTER to read full post below containing analysis. In case of any error or you think you are not able to read the full post below, please email us at support#nehcap.com [lwa][/s2If] [s2If current_user_can(access_s2member_level1)]
- A combination of factors prompts aggressive selling around AUD/USD on Tuesday.
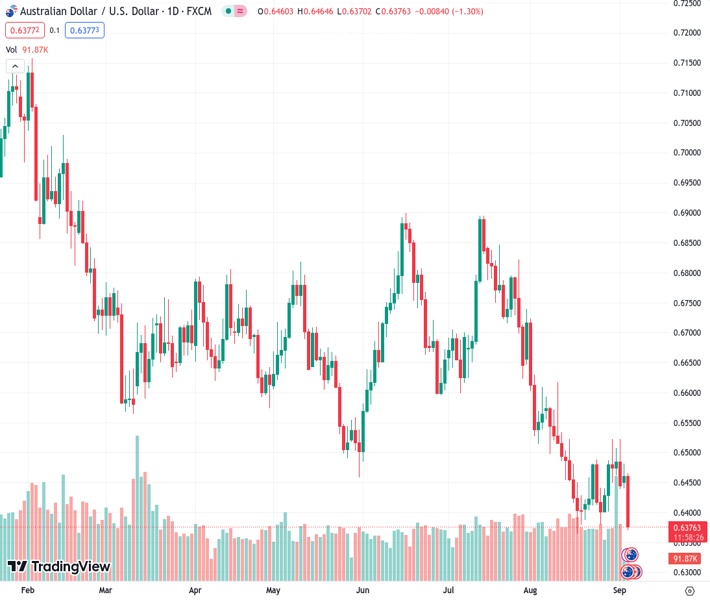
The pair currently trades last at 0.63768.
The previous day high was 0.648 while the previous day low was 0.6445. The daily 38.2% Fib levels comes at 0.6467, expected to provide resistance. Similarly, the daily 61.8% fib level is at 0.6458, expected to provide resistance.
The AUD/USD pair comes under intense selling pressure on Tuesday and extends its steep intraday downfall through the first half of the European session. The momentum drags spot prices to the 0.6370 area, back closer to the YTD low touched in August, and is sponsored by a combination of factors.
The Australian Dollar (AUD) started weakening after a private survey showed that business activity in China’s services sector expanded at its slowest pace in eight months. In fact, the Caixin/S&P Global Services PMI dropped from 54.1 to 51.8 in August, registering the lowest reading since December 2022 and reviving concerns about the worsening conditions in the world’s second-largest economy. This, in turn, tempers investors’ appetite for riskier assets, which, along with the Reserve Bank of Australia’s (RBA) on-hold decision, prompt aggressive selling around the AUD/USD pair.
As was widely anticipated, the Australian central bank decided to stick to its wait-and-see stance and left the Official Cash Rate (OCR) unchanged at 4.10% for the third straight month. In the accompanying monetary policy statement, the RBA reiterated that some further tightening may still be needed to curb inflation, which remains on track to reach the 2-3% target range by mid-2025. The pause, along with the lack of fresh hawkish signals, fuels speculations that the policy tightening cycle might be over and does little to impress bullish traders or lend any support to the AUD/USD pair.
Tuesday’s sharp decline could further be attributed to resurgent US Dollar (USD) demand, bolstered by growing acceptance that the Federal Reserve (Fed) will keep interest rates higher for longer. Despite signs that labour market conditions in the US were easing, the markets are still pricing in the possibility of one more 25 bps Fed rate hike move by the end of this year. This, in turn, triggers a fresh leg up in the US Treasury bond yields and pushes the USD to over a three-month high, which further contributes to the heavily offered tone surrounding the AUD/USD pair.
Apart from the aforementioned fundamental factors, a sustained break through an ascending trend-line, extending from the YTD low, aggravates the bearish pressure. Moreover, acceptance below the 0.6400 round-figure mark could be seen as a fresh trigger for bearish traders and suggests that the path of least resistance for the AUD/USD pair is to the downside. That said, the extremely oversold Relative Strength Index (RSI) on hourly charts makes it prudent to wait for some intraday consolidation before traders start positioning for any further depreciating move.
Technical Levels: Supports and Resistances
AUDUSD currently trading at 0.6379 at the time of writing. Pair opened at 0.6462 and is trading with a change of -1.28 % .
| Overview | Overview.1 | |
|---|---|---|
| 0 | Today last price | 0.6379 |
| 1 | Today Daily Change | -0.0083 |
| 2 | Today Daily Change % | -1.2800 |
| 3 | Today daily open | 0.6462 |
The pair remains strongly bearish on the daily time frame. It trades below the 20 SMA @ 0.6459, 50 SMA 0.6602, 100 SMA @ 0.6641 and 200 SMA @ 0.672.
| Trends | Trends.1 | |
|---|---|---|
| 0 | Daily SMA20 | 0.6459 |
| 1 | Daily SMA50 | 0.6602 |
| 2 | Daily SMA100 | 0.6641 |
| 3 | Daily SMA200 | 0.6720 |
The previous day high was 0.648 while the previous day low was 0.6445. The daily 38.2% Fib levels comes at 0.6467, expected to provide resistance. Similarly, the daily 61.8% fib level is at 0.6458, expected to provide resistance.
Note the levels of interest below:
- Pivot support is noted at 0.6444, 0.6427, 0.6409
- Pivot resistance is noted at 0.648, 0.6498, 0.6515
| Levels | Levels.1 |
|---|---|
| Previous Daily High | 0.6480 |
| Previous Daily Low | 0.6445 |
| Previous Weekly High | 0.6522 |
| Previous Weekly Low | 0.6401 |
| Previous Monthly High | 0.6724 |
| Previous Monthly Low | 0.6364 |
| Daily Fibonacci 38.2% | 0.6467 |
| Daily Fibonacci 61.8% | 0.6458 |
| Daily Pivot Point S1 | 0.6444 |
| Daily Pivot Point S2 | 0.6427 |
| Daily Pivot Point S3 | 0.6409 |
| Daily Pivot Point R1 | 0.6480 |
| Daily Pivot Point R2 | 0.6498 |
| Daily Pivot Point R3 | 0.6515 |
[/s2If]
Download Nehcap EAWe have two EAs that are operational on our LIVE accounts.
- EA-FIX: Check out the details here. Download EA-FIX . EA-FIX is a non-grid HFT scalper.
- EA-GROWTH: High quality low dd EA using trend grids. Download EA_GROWTHJoin Our Telegram Group
")


