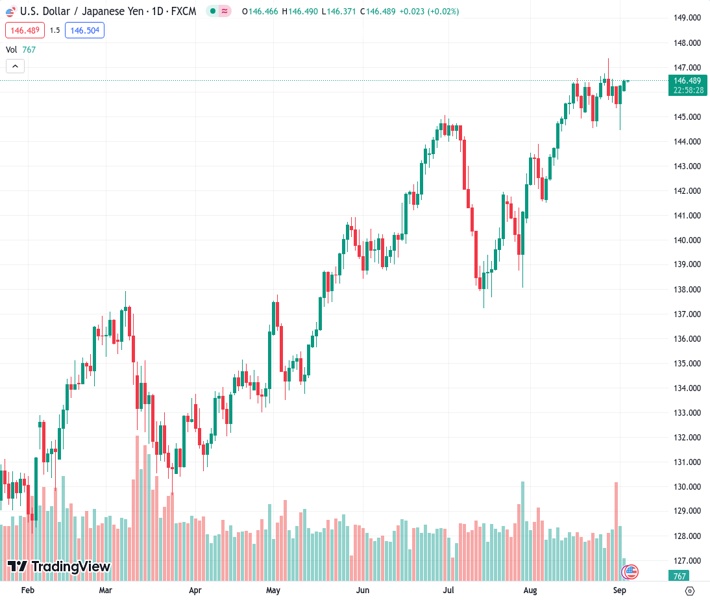
The USDJPY pair experienced slight declines within a limited span on Monday, trading at 146.467, before ultimately ending at 146.40.
…
This is a premium post.
[s2If !current_user_can(access_s2member_level4)]Please register for FREE REGISTER to read full post below containing analysis. In case of any error or you think you are not able to read the full post below, please email us at support#nehcap.com [lwa][/s2If] [s2If current_user_can(access_s2member_level1)]
- USD/JPY traded with mild losses in a narrow range on Monday and closed at 146.40.
The pair currently trades last at 146.467.
The previous day high was 146.29 while the previous day low was 144.44. The daily 38.2% Fib levels comes at 145.59, expected to provide support. Similarly, the daily 61.8% fib level is at 145.15, expected to provide support.
At the start of the week, the USD/JPY saw little movement, with both currencies trading weak against most of their rivals. The USD traded soft after last week’s key events. Nonfarm Payrolls showed a mixed picture, while the ISM Manufacturing PMI rose higher than expected and the Core Personal Consumption Expenditures came in hot. Focus now shifts to Service sector PMI surveys from the ISM to be released on Wednesday, which will help investors to continue modelling their expectations regarding the next Federal Reserve (Fed) decisions.
The USD is trading soft on Monday after last week’s key events. Nonfarm Payrolls showed a mixed picture, while the August ISM Manufacturing PMI rose higher than expected as well as the Core Personal Consumption Expenditures from July. Focus now shifts to Service sector PMI surveys from the ISM to be released on Wednesday, which will help investors to continue modelling their expectations regarding the next Federal Reserve (Fed) decisions.
According to the CME FedWatch tool, the odds of an extra 0.25% tightening throughout the period leading to the December meeting had somewhat eased, but investors are still placing some bets on it. If the Fed opts for another hike, it would lift rates to 5.75%.
On the Yen’s side, local wage and inflation data will play a pivotal role in the Bank of Japan’s (BoJ) considerations for potential adjustments to monetary policy. In that sense, at the early Asian session on Thursday, Japan will report household spending and earnings figures from July, and their outcome will influence the expectations of the following BoJ decisions.
Analysing the daily chart, the USD/JPY technical outlook is bullish in the short term. The Relative Strength Index (RSI) is positioned above its midline in positive territory. It has a northward slope, indicating a favourable buying momentum. It is further supported by the positive signal from the Moving Average Convergence Divergence (MACD), which displays green bars, underscoring the growing bullish momentum. Also, the pair is above the 20,100,200-day Simple Moving Average (SMA), indicating a favourable position for the bulls in the bigger picture.
Support levels: 145.72 (20-day SMA), 145.00, 144.00.
Resistance levels: 146.80, 147.00, 147.40.
Technical Levels: Supports and Resistances
USDJPY currently trading at 146.45 at the time of writing. Pair opened at 146.23 and is trading with a change of 0.15 % .
| Overview | Overview.1 | |
|---|---|---|
| 0 | Today last price | 146.45 |
| 1 | Today Daily Change | 0.22 |
| 2 | Today Daily Change % | 0.15 |
| 3 | Today daily open | 146.23 |
The pair remains strongly bullish on the daily timeframe. It trades above its 20 SMA @ 145.38, 50 SMA 143.23, 100 SMA @ 140.52 and 200 SMA @ 136.83.
| Trends | Trends.1 | |
|---|---|---|
| 0 | Daily SMA20 | 145.38 |
| 1 | Daily SMA50 | 143.23 |
| 2 | Daily SMA100 | 140.52 |
| 3 | Daily SMA200 | 136.83 |
The previous day high was 146.29 while the previous day low was 144.44. The daily 38.2% Fib levels comes at 145.59, expected to provide support. Similarly, the daily 61.8% fib level is at 145.15, expected to provide support.
Note the levels of interest below:
- Pivot support is noted at 145.02, 143.8, 143.16
- Pivot resistance is noted at 146.87, 147.51, 148.72
| Levels | Levels.1 |
|---|---|
| Previous Daily High | 146.29 |
| Previous Daily Low | 144.44 |
| Previous Weekly High | 147.38 |
| Previous Weekly Low | 144.44 |
| Previous Monthly High | 147.38 |
| Previous Monthly Low | 141.51 |
| Daily Fibonacci 38.2% | 145.59 |
| Daily Fibonacci 61.8% | 145.15 |
| Daily Pivot Point S1 | 145.02 |
| Daily Pivot Point S2 | 143.80 |
| Daily Pivot Point S3 | 143.16 |
| Daily Pivot Point R1 | 146.87 |
| Daily Pivot Point R2 | 147.51 |
| Daily Pivot Point R3 | 148.72 |
[/s2If]
Download Nehcap EAWe have two EAs that are operational on our LIVE accounts.
- EA-FIX: Check out the details here. Download EA-FIX . EA-FIX is a non-grid HFT scalper.
- EA-GROWTH: High quality low dd EA using trend grids. Download EA_GROWTHJoin Our Telegram Group
")


