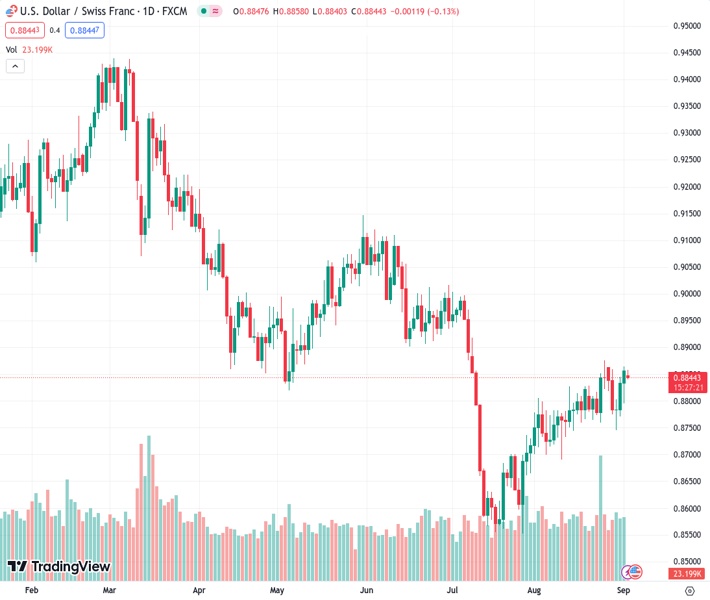
The USDCHF currency pair, currently at a value of 0.88443, has experienced its first decline in the past three days amidst a month-long upward trend. This is the perspective of @nehcap who believes that the overall sentiment is still positive.
…
This is a premium post.
[s2If !current_user_can(access_s2member_level4)]Please register for FREE REGISTER to read full post below containing analysis. In case of any error or you think you are not able to read the full post below, please email us at support#nehcap.com [lwa][/s2If] [s2If current_user_can(access_s2member_level1)]
- USD/CHF prints the first daily loss in three within one-month-old rising trend channel.
The pair currently trades last at 0.88443.
The previous day high was 0.8864 while the previous day low was 0.8795. The daily 38.2% Fib levels comes at 0.8838, expected to provide support. Similarly, the daily 61.8% fib level is at 0.8821, expected to provide support.
USD/CHF bulls take a breather ahead of the key Swiss Q2 GDP heading into Monday’s European session. In doing so, the Swiss Franc (CHF) pair prints the first daily loss in three despite staying within a one-month-old bullish trend channel.
That said, not only an upward-sloping bullish trend channel from early August but the bullish MACD signals and the upbeat RSI (14) line also keeps the USD/CHF pair buyers hopeful ahead of the Swiss second-quarter (Q2) Gross Domestic Product (GDP), expected 0.1% QoQ versus 0.3% prior.
It’s worth noting that an ascending trend line from last Wednesday, close to 0.8815 by the press time, quickly followed by the 0.8800 round figure, restricts the short-term USD/CHF downside.
Following that, a convergence of the 200-SMA and the bottom line of the stated bullish channel, close to 0.8755, will challenge the Swiss Franc (CHF) pair’s further downside.
Above all, the USD/CHF pair buyers remain hopeful unless they witness a clear downside break of the previous resistance line stretched from early June, close to 0.8700 at the latest.
On the flip side, the aforementioned channel’s top line surrounding 0.8890 precedes June’s bottom of around the 0.8900 threshold, to check the USD/CHF bulls.
Trend: Bullish
Technical Levels: Supports and Resistances
USDCHF currently trading at 0.8846 at the time of writing. Pair opened at 0.8857 and is trading with a change of -0.12% % .
| Overview | Overview.1 | |
|---|---|---|
| 0 | Today last price | 0.8846 |
| 1 | Today Daily Change | -0.0011 |
| 2 | Today Daily Change % | -0.12% |
| 3 | Today daily open | 0.8857 |
The pair is trading above its 20 Daily moving average @ 0.8796, above its 50 Daily moving average @ 0.8783 , below its 100 Daily moving average @ 0.8882 and below its 200 Daily moving average @ 0.9067
| Trends | Trends.1 | |
|---|---|---|
| 0 | Daily SMA20 | 0.8796 |
| 1 | Daily SMA50 | 0.8783 |
| 2 | Daily SMA100 | 0.8882 |
| 3 | Daily SMA200 | 0.9067 |
The previous day high was 0.8864 while the previous day low was 0.8795. The daily 38.2% Fib levels comes at 0.8838, expected to provide support. Similarly, the daily 61.8% fib level is at 0.8821, expected to provide support.
Note the levels of interest below:
- Pivot support is noted at 0.8814, 0.877, 0.8745
- Pivot resistance is noted at 0.8882, 0.8907, 0.8951
| Levels | Levels.1 |
|---|---|
| Previous Daily High | 0.8864 |
| Previous Daily Low | 0.8795 |
| Previous Weekly High | 0.8865 |
| Previous Weekly Low | 0.8745 |
| Previous Monthly High | 0.8876 |
| Previous Monthly Low | 0.8690 |
| Daily Fibonacci 38.2% | 0.8838 |
| Daily Fibonacci 61.8% | 0.8821 |
| Daily Pivot Point S1 | 0.8814 |
| Daily Pivot Point S2 | 0.8770 |
| Daily Pivot Point S3 | 0.8745 |
| Daily Pivot Point R1 | 0.8882 |
| Daily Pivot Point R2 | 0.8907 |
| Daily Pivot Point R3 | 0.8951 |
[/s2If]
Download Nehcap EAWe have two EAs that are operational on our LIVE accounts.
- EA-FIX: Check out the details here. Download EA-FIX . EA-FIX is a non-grid HFT scalper.
- EA-GROWTH: High quality low dd EA using trend grids. Download EA_GROWTHJoin Our Telegram Group
")


