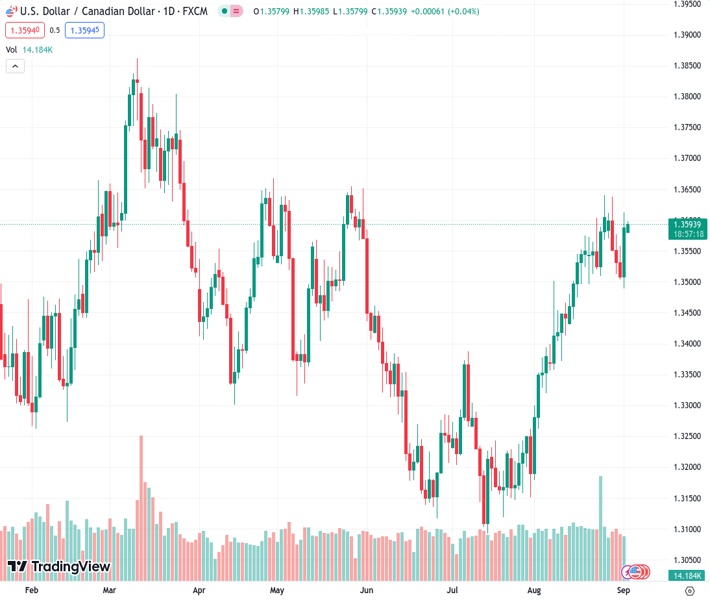
The USDCAD currency pair is experiencing an increase in value, trading at approximately 1.3590, following the release of data from both the United States and Canada last week.
…
This is a premium post.
[s2If !current_user_can(access_s2member_level4)]Please register for FREE REGISTER to read full post below containing analysis. In case of any error or you think you are not able to read the full post below, please email us at support#nehcap.com [lwa][/s2If] [s2If current_user_can(access_s2member_level1)]
- USD/CAD trades higher around 1.3590 after data releases from both countries last week.
The pair currently trades last at 1.35955.
The previous day high was 1.3613 while the previous day low was 1.3489. The daily 38.2% Fib levels comes at 1.3566, expected to provide support. Similarly, the daily 61.8% fib level is at 1.3536, expected to provide support.
USD/CAD trades higher around 1.3590, extending gains on the second day during the Asian session on Monday. The Canadian Dollar (CAD) is experiencing downward support against the US Dollar (USD), which is attributed to the data releases from the United States (US) and Canada.
As said, Canada’s Gross Domestic Product (GDP) unexpectedly contracted at the rate of 0.2% annually in the second quarter, against the expected growth of 1.2%. The growth figure was 2.6% in the first quarter. S&P Global Manufacturing PMI report for August showed a reduction, with a reading of 48, compared to the market expectations of 49.2 and from 49.6 prior.
The USD/CAD pair faced downward pressure due to data figures that fell below expectations. The Bank of Canada (BoC) is set to announce its monetary policy decision this Wednesday, and the disappointing GDP figure may impact the anticipated 25 basis point (bps) rate hike by the BoC.
However, the improved prices of US crude oil might have limited the gains of the Loonie pair. The Western Texas Intermediate (WTI) price rose to a new year-to-date (YTD) high of $85.57, following the expected supply cuts of 1 million barrels per day (bpd) by Saudi Arabia in October. Additionally, Russia agrees with the Organization of the Petroleum Exporting Countries (OPEC) and its allies on the decision.
On the other hand, the US Nonfarm Payrolls (Aug) report showed improvement in job creation. The data reported a 187K figure, higher than the expected reading of 170K. The data reported 157K figure in the month of July. ISM Manufacturing PMI rose to 47.6, from the previous reading of 46.4. The market consensus was 47.
The robust jobs and manufacturing data support the Greenback which gauges the performance of the US Dollar (USD) against the six other major currencies. Spot treads waters around 104.20 at the time of writing. However, market participants seek further indications from the US Federal Reserve (Fed) on the policy decision in the upcoming meeting.
Technical Levels: Supports and Resistances
USDCAD currently trading at 1.3591 at the time of writing. Pair opened at 1.3594 and is trading with a change of -0.02 % .
| Overview | Overview.1 | |
|---|---|---|
| 0 | Today last price | 1.3591 |
| 1 | Today Daily Change | -0.0003 |
| 2 | Today Daily Change % | -0.0200 |
| 3 | Today daily open | 1.3594 |
The pair remains strongly bullish on the daily timeframe. It trades above its 20 SMA @ 1.3514, 50 SMA 1.3346, 100 SMA @ 1.3396 and 200 SMA @ 1.3464.
| Trends | Trends.1 | |
|---|---|---|
| 0 | Daily SMA20 | 1.3514 |
| 1 | Daily SMA50 | 1.3346 |
| 2 | Daily SMA100 | 1.3396 |
| 3 | Daily SMA200 | 1.3464 |
The previous day high was 1.3613 while the previous day low was 1.3489. The daily 38.2% Fib levels comes at 1.3566, expected to provide support. Similarly, the daily 61.8% fib level is at 1.3536, expected to provide support.
Note the levels of interest below:
- Pivot support is noted at 1.3518, 1.3442, 1.3395
- Pivot resistance is noted at 1.3642, 1.3689, 1.3765
| Levels | Levels.1 |
|---|---|
| Previous Daily High | 1.3613 |
| Previous Daily Low | 1.3489 |
| Previous Weekly High | 1.3637 |
| Previous Weekly Low | 1.3489 |
| Previous Monthly High | 1.3640 |
| Previous Monthly Low | 1.3184 |
| Daily Fibonacci 38.2% | 1.3566 |
| Daily Fibonacci 61.8% | 1.3536 |
| Daily Pivot Point S1 | 1.3518 |
| Daily Pivot Point S2 | 1.3442 |
| Daily Pivot Point S3 | 1.3395 |
| Daily Pivot Point R1 | 1.3642 |
| Daily Pivot Point R2 | 1.3689 |
| Daily Pivot Point R3 | 1.3765 |
[/s2If]
Download Nehcap EAWe have two EAs that are operational on our LIVE accounts.
- EA-FIX: Check out the details here. Download EA-FIX . EA-FIX is a non-grid HFT scalper.
- EA-GROWTH: High quality low dd EA using trend grids. Download EA_GROWTHJoin Our Telegram Group
")


