The US dollar to Mexican peso exchange rate increases as a result of Banxico’s choice to decrease its currency hedging program.
…
This is a premium post.
[s2If !current_user_can(access_s2member_level4)]Please register for FREE REGISTER to read full post below containing analysis. In case of any error or you think you are not able to read the full post below, please email us at support#nehcap.com [lwa][/s2If] [s2If current_user_can(access_s2member_level1)]
- Banxico’s decision to reduce its currency hedging program sends the pair higher.
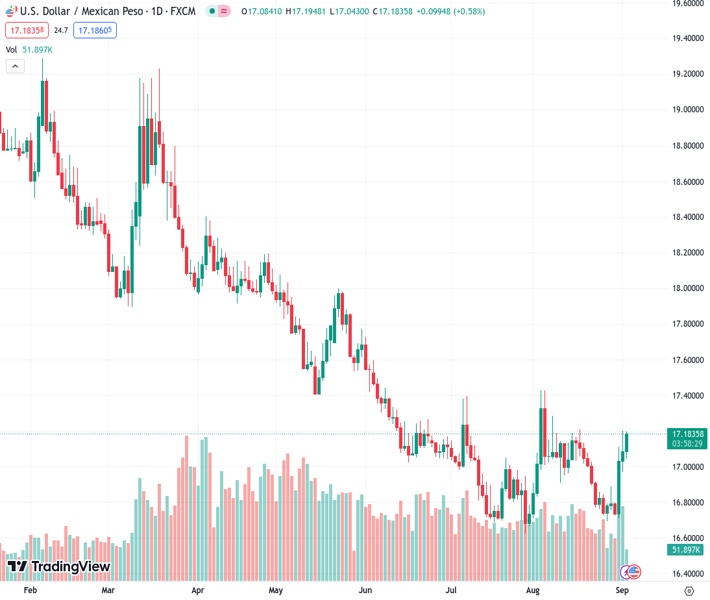
The pair currently trades last at 17.1816.
The previous day high was 17.2025 while the previous day low was 16.9727. The daily 38.2% Fib levels comes at 17.1147, expected to provide support. Similarly, the daily 61.8% fib level is at 17.0605, expected to provide support.
The Mexican Peso (MXN) prolonged its losses by more than 0.50% versus the US Dollar (USD) after the Bank of Mexico (Banxico) decided to slash its hedging program due to stabilizing the USD/MXN exchange rate amid geopolitical and Covid-19 uncertainty. Hence, the pair trades at 17.1792 after hitting a daily low of 17.0430.
Last week’s news that Banxico would reduce its currency hedging program sent the USD/MXN pair into a tailspin, as the program was designed to tame volatility, seen by traders as an exit signal from its long positions. On August 31, the USD/MXN posted more than 1.70% gains after Banxico’s decision.
On Friday, the latest US employment figures revealed the US Nonfarm Payrolls (NFP) rose to 187K in August versus 170K expected and 157K prior (revised). Nevertheless, the Unemployment Rate rising to 3.8% from the 3.5% market forecasts and previous readings stalled the Greenback rally, as the data was seen as a justification for the Fed to keep interest rates unchanged at the September meeting.
Other data The US ISM Manufacturing PMI also impressed the US Dollar buyers with the 47.6 figures versus analysts’ estimation of 47.0 versus 46.4 previous readings.
In the central bank action, Cleveland’s Fed President Loretta Mester states that the Unemployment Rate remains low, and she still sees the jobs market as quite strong. However, the policymaker remains hawkish and has seen higher rates for longer.
On the Mexican front, Banxico’s Governor Victoria Rodriguez Ceja took off from the table rate cuts, as she added, “The outlook ahead continues to be complex and uncertain. It’s important to remember that disinflation periods are not linear.”
Upcoming data will see the release of Mexican inflation figures for August, and the US ISM Non-Manufacturing PMI will give direction to the USD/MXN pair. Nevertheless, expect further Mexican Peso weakness after Banxico’s hedge cuts.
The USD/MXN is consolidating, with the pair unable to crack to new year-to-date (YTD) lows while reversing its course, threatening to edge higher if it reclaims a mult-month downslope resistance trendline and the 50-day Moving Average (DMA) at around 17.20/17.2900. If that area is reclaimed, look for buyers to test the May 17 daily low turned resistance at 17.4038, seen as a crucial level to overcome, before testing the confluence of the 200-DMA and the psychological 18.0000 figure. On the downside, risks emerge below the confluence of the 20 and 50-DMA at around 16.98/96.
Technical Levels: Supports and Resistances
USDMXN currently trading at 17.1762 at the time of writing. Pair opened at 17.0944 and is trading with a change of 0.48 % .
| Overview | Overview.1 | |
|---|---|---|
| 0 | Today last price | 17.1762 |
| 1 | Today Daily Change | 0.0818 |
| 2 | Today Daily Change % | 0.4800 |
| 3 | Today daily open | 17.0944 |
The pair is trading above its 20 Daily moving average @ 16.9814, above its 50 Daily moving average @ 16.9721 , below its 100 Daily moving average @ 17.3048 and below its 200 Daily moving average @ 18.0648
| Trends | Trends.1 | |
|---|---|---|
| 0 | Daily SMA20 | 16.9814 |
| 1 | Daily SMA50 | 16.9721 |
| 2 | Daily SMA100 | 17.3048 |
| 3 | Daily SMA200 | 18.0648 |
The previous day high was 17.2025 while the previous day low was 16.9727. The daily 38.2% Fib levels comes at 17.1147, expected to provide support. Similarly, the daily 61.8% fib level is at 17.0605, expected to provide support.
Note the levels of interest below:
- Pivot support is noted at 16.9773, 16.8601, 16.7474
- Pivot resistance is noted at 17.2071, 17.3197, 17.4369
| Levels | Levels.1 |
|---|---|
| Previous Daily High | 17.2025 |
| Previous Daily Low | 16.9727 |
| Previous Weekly High | 17.2025 |
| Previous Weekly Low | 16.6945 |
| Previous Monthly High | 17.4274 |
| Previous Monthly Low | 16.6945 |
| Daily Fibonacci 38.2% | 17.1147 |
| Daily Fibonacci 61.8% | 17.0605 |
| Daily Pivot Point S1 | 16.9773 |
| Daily Pivot Point S2 | 16.8601 |
| Daily Pivot Point S3 | 16.7474 |
| Daily Pivot Point R1 | 17.2071 |
| Daily Pivot Point R2 | 17.3197 |
| Daily Pivot Point R3 | 17.4369 |
[/s2If]
Download Nehcap EAWe have two EAs that are operational on our LIVE accounts.
- EA-FIX: Check out the details here. Download EA-FIX . EA-FIX is a non-grid HFT scalper.
- EA-GROWTH: High quality low dd EA using trend grids. Download EA_GROWTHJoin Our Telegram Group
")


