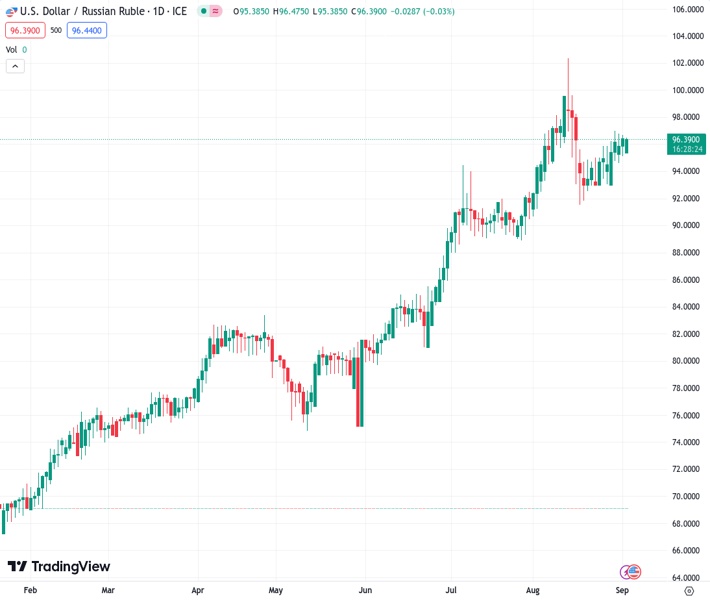
The exchange rate of the US dollar against the Russian ruble, represented by #USDRUB @ 96.4100, is currently experiencing slight increases around 96.40 due to the weakness of the ruble.
…
This is a premium post.
[s2If !current_user_can(access_s2member_level4)]Please register for FREE REGISTER to read full post below containing analysis. In case of any error or you think you are not able to read the full post below, please email us at support#nehcap.com [lwa][/s2If] [s2If current_user_can(access_s2member_level1)]
- USD/RUB trades with modest gains around 96.40 amid the Russian Ruble weakness.
The pair currently trades last at 96.4100.
The previous day high was 96.72 while the previous day low was 95.215. The daily 38.2% Fib levels comes at 96.1451, expected to provide support. Similarly, the daily 61.8% fib level is at 95.7899, expected to provide support.
USD/RUB extends its upside during the early European session on Monday. The pair currently trades near 96.40, unchanged for the day. The pair trades in positive territory for the third consecutive week amid the Russian Ruble’s depreciation.
According to data published last week, Russia’s S&P Global Manufacturing PMI for August came in at 52.7 versus the market consensus of 52.1. The figure climbed the highest in three months. Earlier, the Unemployment Rate for July declined to 3.0% from 3.1% in June and 3.2% market expectation.
Apart from this, Finance Minister Anton Siluanov forecast that the Russian economy is expected to grow by at least 2.5% in 2023, with inflation hovering around 6%. He also said that he would work with the Central Bank to take all necessary actions to bring inflation down to the appropriate level. It’s worth noting that the Bank of Russia hiked the interest rate by 350 basis points (bps) to 12% on August 15 to halt the ruble’s slide amid the the turmoil in Ukraine war.
On the other hand, Nonfarm Payrolls (NFP) for August in the US came in at 187K, exceeding the estimate of 170K and July’s reading of 157K. The Unemployment Rate decreased considerably to 3.8%, compared to the market’s estimate of 3.5% and the previous reading of 3.5%. The monthly Average Hourly Earnings increased by 0.2% instead of 0.3%.
Following the Nonfarm Payrolls report, the US Dollar (USD) fell across the board as traders expect the Federal Reserve to end the tightening cycle. However, the Greenback reversed its course after the US PMI data. The Manufacturing PMI improved to 47.6 versus 46.4 prior and better than the market estimation of 47.0.
Market players will take cues from the US Service PMI data due later this week and find opportunities around USD/RUB. The data could offer hints about the path of further interest rate decisions by the Federal Reserve (Fed)
Technical Levels: Supports and Resistances
USDRUB currently trading at 60.95 at the time of writing. Pair opened at 96.405 and is trading with a change of -36.78 % .
| Overview | Overview.1 | |
|---|---|---|
| 0 | Today last price | 60.950 |
| 1 | Today Daily Change | -35.455 |
| 2 | Today Daily Change % | -36.780 |
| 3 | Today daily open | 96.405 |
The pair remains strongly bearish on the daily time frame. It trades below the 20 SMA @ 95.8993, 50 SMA 92.6142, 100 SMA @ 86.8033 and 200 SMA @ 79.5882.
| Trends | Trends.1 | |
|---|---|---|
| 0 | Daily SMA20 | 95.8993 |
| 1 | Daily SMA50 | 92.6142 |
| 2 | Daily SMA100 | 86.8033 |
| 3 | Daily SMA200 | 79.5882 |
The previous day high was 96.72 while the previous day low was 95.215. The daily 38.2% Fib levels comes at 96.1451, expected to provide support. Similarly, the daily 61.8% fib level is at 95.7899, expected to provide support.
Note the levels of interest below:
- Pivot support is noted at 95.5067, 94.6083, 94.0017
- Pivot resistance is noted at 97.0117, 97.6183, 98.5167
| Levels | Levels.1 |
|---|---|
| Previous Daily High | 96.7200 |
| Previous Daily Low | 95.2150 |
| Previous Weekly High | 97.0570 |
| Previous Weekly Low | 93.3715 |
| Previous Monthly High | 102.3800 |
| Previous Monthly Low | 90.8215 |
| Daily Fibonacci 38.2% | 96.1451 |
| Daily Fibonacci 61.8% | 95.7899 |
| Daily Pivot Point S1 | 95.5067 |
| Daily Pivot Point S2 | 94.6083 |
| Daily Pivot Point S3 | 94.0017 |
| Daily Pivot Point R1 | 97.0117 |
| Daily Pivot Point R2 | 97.6183 |
| Daily Pivot Point R3 | 98.5167 |
[/s2If]
Download Nehcap EAWe have two EAs that are operational on our LIVE accounts.
- EA-FIX: Check out the details here. Download EA-FIX . EA-FIX is a non-grid HFT scalper.
- EA-GROWTH: High quality low dd EA using trend grids. Download EA_GROWTHJoin Our Telegram Group
")


