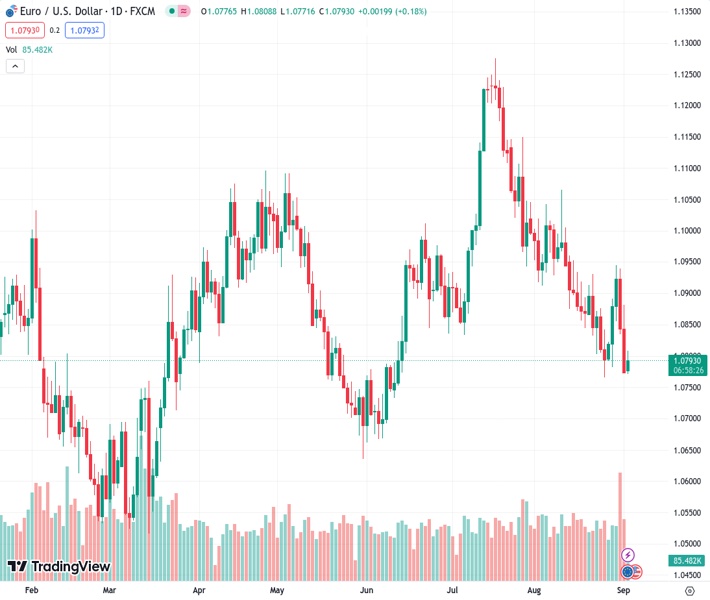
The EUR/USD currency pair, which was trading at 1.07956, changes direction and moves back up to the 1.0800 range.
…
This is a premium post.
[s2If !current_user_can(access_s2member_level4)]Please register for FREE REGISTER to read full post below containing analysis. In case of any error or you think you are not able to read the full post below, please email us at support#nehcap.com [lwa][/s2If] [s2If current_user_can(access_s2member_level1)]
- EUR/USD makes a U-turn and regains the 1.0800 zone.
The pair currently trades last at 1.07956.
The previous day high was 1.0882 while the previous day low was 1.0772. The daily 38.2% Fib levels comes at 1.0814, expected to provide resistance. Similarly, the daily 61.8% fib level is at 1.084, expected to provide resistance.
EUR/USD manages to pick up some traction and reclaims the area above 1.0800 the figure at the beginning of the week.
The sharp retracement seen in the latter part of last week seems to have shifted the attention to the downside. Against that, the next contention area aligns at the August low of 1.0765 (August 25) prior to the May low of 1.0635 (May 31).
In the meantime, further losses remain in the pipeline while below the key 200-day SMA, today at 1.0817.
Technical Levels: Supports and Resistances
EURUSD currently trading at 1.0804 at the time of writing. Pair opened at 1.0776 and is trading with a change of 0.26 % .
| Overview | Overview.1 | |
|---|---|---|
| 0 | Today last price | 1.0804 |
| 1 | Today Daily Change | 37.0000 |
| 2 | Today Daily Change % | 0.2600 |
| 3 | Today daily open | 1.0776 |
The pair remains strongly bearish on the daily time frame. It trades below the 20 SMA @ 1.0888, 50 SMA 1.0968, 100 SMA @ 1.0922 and 200 SMA @ 1.0816.
| Trends | Trends.1 | |
|---|---|---|
| 0 | Daily SMA20 | 1.0888 |
| 1 | Daily SMA50 | 1.0968 |
| 2 | Daily SMA100 | 1.0922 |
| 3 | Daily SMA200 | 1.0816 |
The previous day high was 1.0882 while the previous day low was 1.0772. The daily 38.2% Fib levels comes at 1.0814, expected to provide resistance. Similarly, the daily 61.8% fib level is at 1.084, expected to provide resistance.
Note the levels of interest below:
- Pivot support is noted at 1.0738, 1.07, 1.0629
- Pivot resistance is noted at 1.0848, 1.092, 1.0958
| Levels | Levels.1 |
|---|---|
| Previous Daily High | 1.0882 |
| Previous Daily Low | 1.0772 |
| Previous Weekly High | 1.0946 |
| Previous Weekly Low | 1.0772 |
| Previous Monthly High | 1.1065 |
| Previous Monthly Low | 1.0766 |
| Daily Fibonacci 38.2% | 1.0814 |
| Daily Fibonacci 61.8% | 1.0840 |
| Daily Pivot Point S1 | 1.0738 |
| Daily Pivot Point S2 | 1.0700 |
| Daily Pivot Point S3 | 1.0629 |
| Daily Pivot Point R1 | 1.0848 |
| Daily Pivot Point R2 | 1.0920 |
| Daily Pivot Point R3 | 1.0958 |
[/s2If]
Download Nehcap EAWe have two EAs that are operational on our LIVE accounts.
- EA-FIX: Check out the details here. Download EA-FIX . EA-FIX is a non-grid HFT scalper.
- EA-GROWTH: High quality low dd EA using trend grids. Download EA_GROWTHJoin Our Telegram Group
")


