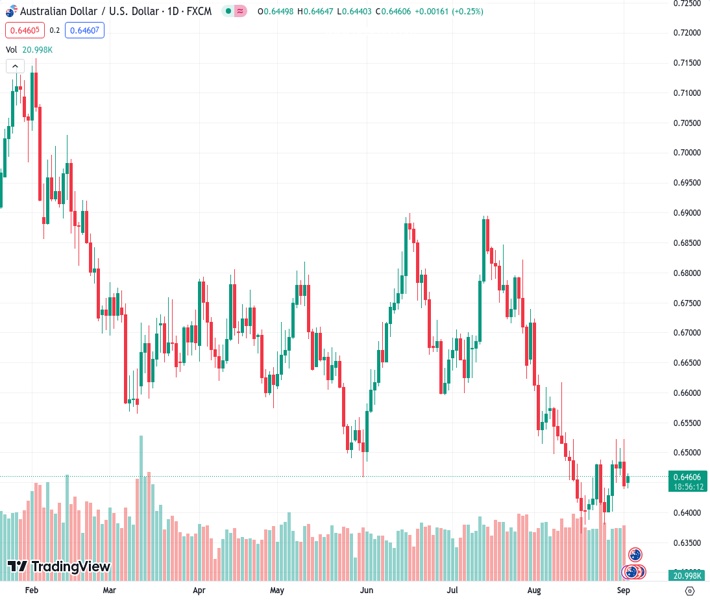
The AUDUSD currency pair rose on Monday at a rate of 0.64587, but did not receive much additional buying support to sustain the momentum.
…
This is a premium post.
[s2If !current_user_can(access_s2member_level4)]Please register for FREE REGISTER to read full post below containing analysis. In case of any error or you think you are not able to read the full post below, please email us at support#nehcap.com [lwa][/s2If] [s2If current_user_can(access_s2member_level1)]
- AUD/USD regains positive traction on Monday, albeit lacks follow-through buying.
The pair currently trades last at 0.64587.
The previous day high was 0.6522 while the previous day low was 0.6438. The daily 38.2% Fib levels comes at 0.647, expected to provide resistance. Similarly, the daily 61.8% fib level is at 0.649, expected to provide resistance.
The AUD/USD pair attracts some dip-buying near the 0.6440 area or a four-day low touched during the Asian session on Monday and stalls last week’s modest pullback from the 0.6520 region, or its highest level since August 11. Spot prices currently trade near the 0.6465 zone, up just over 0.10% for the day, and draw support from subdued US Dollar (USD) price action.
The mixed US monthly employment details released on Friday ensure that the Fed will leave rates unchanged at its September meeting and fails to assist the USD to capitalize on Friday’s strong move up closer to the August monthly swing high. This, in turn, is seen as a key factor acting as a tailwind for the AUD/USD pair. The markets, however, are still pricing in the possibility of one more 25 bps lift-off by the end of this year. This might hold back traders from placing aggressive bearish bets around the USD and keep a lid on the major ahead of the Reserve Bank of Australia (RBA) monetary policy meeting on Tuesday.
From a technical perspective, the AUD/USD pair’s recent bounce from the 0.6365 area, or the YTD low touched in August, has been along an upward-sloping channel. Against the backdrop of a sharp downfall from the double-top resistance near the 0.6900 mark, this constitutes the formation of a bearish flag pattern on hourly charts. Moreover, oscillators on the daily chart – though have managed to recover from lower levels – are still holding in the negative territory. This suggests that the path of least resistance for spot prices is to the downside and any subsequent move up might still be seen as an opportunity for bearish traders.
Meanwhile, the 200-hour Simple Moving Average (SMA), currently pegged around the mid-0.6400s, is likely to act as a pivotal point for intraday traders. Acceptance below will expose the trend-channel support near the 0.6400 mark, which if broken decisively will mark a fresh breakdown and pave the way for deeper losses. The AUD/USD pair might then accelerate the slide back towards the YTD low, around the 0.6365 region, before eventually dropping to the 0.6300 round figure.
On the flip side, the 0.6500 psychological mark now seems to act as an immediate hurdle ahead of the top end of the aforementioned channel, around the 0.6520-0.6525 region. A convincing breakthrough will negate the bearish setup and prompt an aggressive short-covering move. The AUD/USD pair might then aim to reclaim the 0.6500 round figure. Some follow-through buying beyond and testing the 0.6510-0.6515 resistance zone might shift the bias in favour of bullish traders and pave the way for a further near-term positive move towards the 0.6700 mark en route to the next relevant hurdle near the 0.6725-0.6730 area.
Technical Levels: Supports and Resistances
AUDUSD currently trading at 0.646 at the time of writing. Pair opened at 0.6453 and is trading with a change of 0.11 % .
| Overview | Overview.1 | |
|---|---|---|
| 0 | Today last price | 0.6460 |
| 1 | Today Daily Change | 0.0007 |
| 2 | Today Daily Change % | 0.1100 |
| 3 | Today daily open | 0.6453 |
The pair remains strongly bearish on the daily time frame. It trades below the 20 SMA @ 0.6465, 50 SMA 0.6606, 100 SMA @ 0.6643 and 200 SMA @ 0.6721.
| Trends | Trends.1 | |
|---|---|---|
| 0 | Daily SMA20 | 0.6465 |
| 1 | Daily SMA50 | 0.6606 |
| 2 | Daily SMA100 | 0.6643 |
| 3 | Daily SMA200 | 0.6721 |
The previous day high was 0.6522 while the previous day low was 0.6438. The daily 38.2% Fib levels comes at 0.647, expected to provide resistance. Similarly, the daily 61.8% fib level is at 0.649, expected to provide resistance.
Note the levels of interest below:
- Pivot support is noted at 0.642, 0.6388, 0.6337
- Pivot resistance is noted at 0.6504, 0.6555, 0.6587
| Levels | Levels.1 |
|---|---|
| Previous Daily High | 0.6522 |
| Previous Daily Low | 0.6438 |
| Previous Weekly High | 0.6522 |
| Previous Weekly Low | 0.6401 |
| Previous Monthly High | 0.6724 |
| Previous Monthly Low | 0.6364 |
| Daily Fibonacci 38.2% | 0.6470 |
| Daily Fibonacci 61.8% | 0.6490 |
| Daily Pivot Point S1 | 0.6420 |
| Daily Pivot Point S2 | 0.6388 |
| Daily Pivot Point S3 | 0.6337 |
| Daily Pivot Point R1 | 0.6504 |
| Daily Pivot Point R2 | 0.6555 |
| Daily Pivot Point R3 | 0.6587 |
[/s2If]
Download Nehcap EAWe have two EAs that are operational on our LIVE accounts.
- EA-FIX: Check out the details here. Download EA-FIX . EA-FIX is a non-grid HFT scalper.
- EA-GROWTH: High quality low dd EA using trend grids. Download EA_GROWTHJoin Our Telegram Group
")


