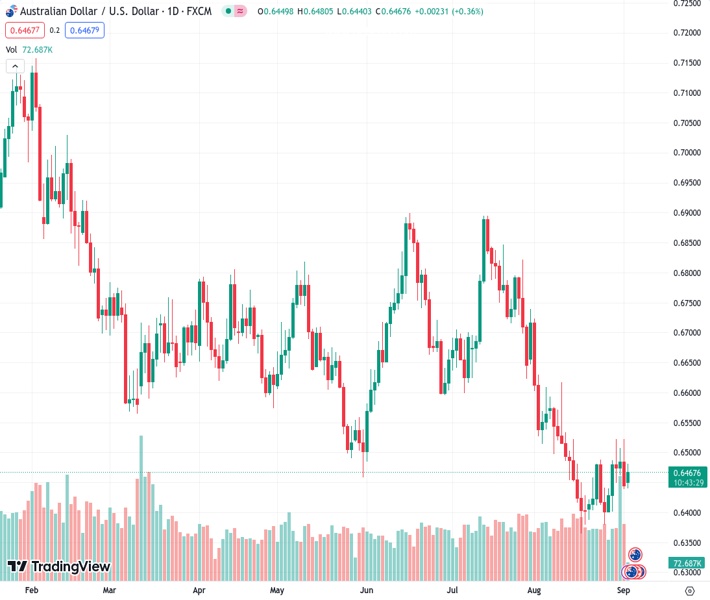
Investors remain cautious and are avoiding making trades on the AUDUSD currency pair, which is trading at 0.64678, as they wait for the Reserve Bank of Australia’s policy announcement.
…
This is a premium post.
[s2If !current_user_can(access_s2member_level4)]Please register for FREE REGISTER to read full post below containing analysis. In case of any error or you think you are not able to read the full post below, please email us at support#nehcap.com [lwa][/s2If] [s2If current_user_can(access_s2member_level1)]
- AUD/USD trades inside Friday’s range as investors sidelined ahead of the RBA policy.
The pair currently trades last at 0.64678.
The previous day high was 0.6522 while the previous day low was 0.6438. The daily 38.2% Fib levels comes at 0.647, expected to provide resistance. Similarly, the daily 61.8% fib level is at 0.649, expected to provide resistance.
The AUD/USD pair auctioned inside Friday’s trading range of 0.6438-0.6522 on Monday as investors await the interest rate decision by the Reserve Bank of Australia (RBA) for its September monetary policy, which will be announced on Tuesday.
According to a Reuters poll, RBA Governor Philip Lowe will keep interest rates unchanged at 4.10% but will keep doors open for more hikes.
Meanwhile, the US Dollar Index (DXY) turns sideways after a rally to near 104.20 inspired by steady hiring momentum recorded for August. The United States Nonfarm Payrolls (NFP) report showed that 187K new employees were recruited in August, which was higher than expectations of 170K and July’s reading of 157K. The Unemployment Rate rose sharply to 3.8% against the consensus and the prior release of 3.5%.
Price action from the AUD/USD pair in a four-hour time frame suggests a Bearish Flag chart pattern formation, which indicates a consolidation in which inventory is transferred from the institutional investors to the retail participants after a vertical sell-off move. A declining 200-period Exponential Moving Average (EMA) indicates that the long-term trend is bearish.
The Relative Strength Index (RSI) (14) trades in a 40.00-60.00 range, which indicates that investors await a fresh trigger.
A fresh downside would appear if the Aussie asset dropped below August 17 low around 0.6360. This would expose the asset to the round-level support of 0.6300 followed by 03 November 2022 low at 0.6272.
On the contrary, a recovery move above August 15 high around 0.6522 will drive the asset to August 9 high at 0.6571. Breach of the latter will drive the asset towards August 10 high at 0.6616.
Technical Levels: Supports and Resistances
AUDUSD currently trading at 0.6462 at the time of writing. Pair opened at 0.6453 and is trading with a change of 0.14 % .
| Overview | Overview.1 | |
|---|---|---|
| 0 | Today last price | 0.6462 |
| 1 | Today Daily Change | 0.0009 |
| 2 | Today Daily Change % | 0.1400 |
| 3 | Today daily open | 0.6453 |
The pair remains strongly bearish on the daily time frame. It trades below the 20 SMA @ 0.6465, 50 SMA 0.6606, 100 SMA @ 0.6643 and 200 SMA @ 0.6721.
| Trends | Trends.1 | |
|---|---|---|
| 0 | Daily SMA20 | 0.6465 |
| 1 | Daily SMA50 | 0.6606 |
| 2 | Daily SMA100 | 0.6643 |
| 3 | Daily SMA200 | 0.6721 |
The previous day high was 0.6522 while the previous day low was 0.6438. The daily 38.2% Fib levels comes at 0.647, expected to provide resistance. Similarly, the daily 61.8% fib level is at 0.649, expected to provide resistance.
Note the levels of interest below:
- Pivot support is noted at 0.642, 0.6388, 0.6337
- Pivot resistance is noted at 0.6504, 0.6555, 0.6587
| Levels | Levels.1 |
|---|---|
| Previous Daily High | 0.6522 |
| Previous Daily Low | 0.6438 |
| Previous Weekly High | 0.6522 |
| Previous Weekly Low | 0.6401 |
| Previous Monthly High | 0.6724 |
| Previous Monthly Low | 0.6364 |
| Daily Fibonacci 38.2% | 0.6470 |
| Daily Fibonacci 61.8% | 0.6490 |
| Daily Pivot Point S1 | 0.6420 |
| Daily Pivot Point S2 | 0.6388 |
| Daily Pivot Point S3 | 0.6337 |
| Daily Pivot Point R1 | 0.6504 |
| Daily Pivot Point R2 | 0.6555 |
| Daily Pivot Point R3 | 0.6587 |
[/s2If]
Download Nehcap EAWe have two EAs that are operational on our LIVE accounts.
- EA-FIX: Check out the details here. Download EA-FIX . EA-FIX is a non-grid HFT scalper.
- EA-GROWTH: High quality low dd EA using trend grids. Download EA_GROWTHJoin Our Telegram Group
")


