Investor sentiment initially improved due to China’s efforts to stimulate its property market, reflected in the NZDUSD at 0.59373.
…
This is a premium post.
[s2If !current_user_can(access_s2member_level4)]Please register for FREE REGISTER to read full post below containing analysis. In case of any error or you think you are not able to read the full post below, please email us at support#nehcap.com [lwa][/s2If] [s2If current_user_can(access_s2member_level1)]
- China’s measures to boost its property market initially lifted investor sentiment.
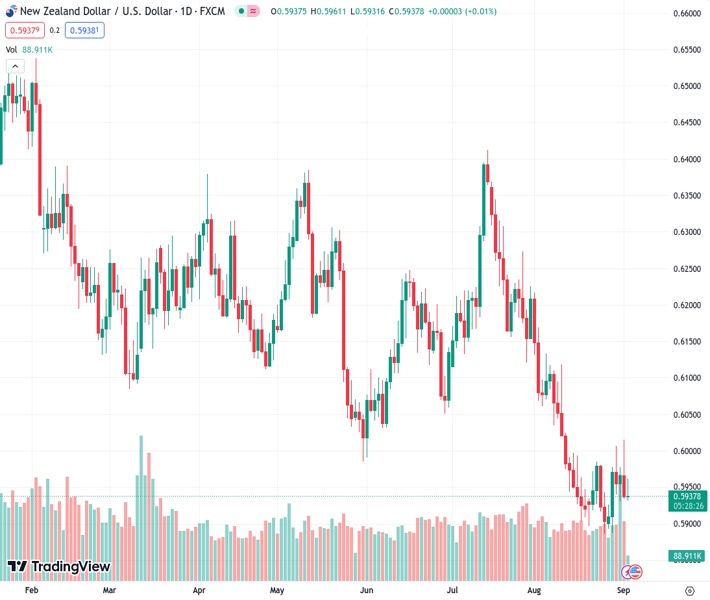
The pair currently trades last at 0.59373.
The previous day high was 0.6015 while the previous day low was 0.5934. The daily 38.2% Fib levels comes at 0.5965, expected to provide resistance. Similarly, the daily 61.8% fib level is at 0.5984, expected to provide resistance.
The New Zealand Dollar (NZD) losses some traction against the Greenback (USD) on thin liquidity conditions due to the observance of Labor Day in the United States (US). Even though China’s measures to boost its economy and a risk-on impulse, the pair is under stress after hitting a daily high of 0.5961. The NZD/USD is trading at 0.5935, down 0.04%.
Price action remains subdued as volume remains scarce. Overnight news from China improved investors’ mood as the country established measures to boost its property market, which is at the brisk of a crisis. As the Government easied measures, home sales rose, as reported by Bloomberg.
Aside from this, traders have begun to price in a less aggressive Federal Reserve (Fed) in the US. Interest rate probabilities for the September meeting remain at 92%, with the first-rate cut seen on May 1, as shown by the bottom picture. On that date, traders foresee rates at around 5.14%, 19 basis points below the effective Federal Funds Rate (FFR) of 5.33%.
Source: Financialsource
The latest round of US data witnessed Nonfarm Payrolls for August at 187K above estimates, which warranted a US Dollar upside in other conditions. Still, it wasn’t the case as the Unemployment Rate rose by 3.8% YoY, above estimates of 3.5%. Analysts at TDS Securities noted, “We think this week’s labor-market and consumer prices data should be judged as positive news by Fed officials, and we continue to view July as the last hike of the Fed’s tightening cycle.”
In the week ahead, the New Zealand economic docket is empty, except for the Global Dairy Trade Price Index release. Nevertheless, one of its largest trading partners, Australia, has scheduled the Reserve Bank of Australia’s (RBA) monetary policy meeting, in which the central bank is expected to keep rates unchanged. In that outcome, the NZD/USD could continue to resume lower unless an upbeat market mood keeps flows going toward riskier assets.
On the US front, a slew of Fed officials would keep traders entertained before policymakers enter their blackout period ahead of September’s monetary policy meeting.
From a technical standpoint, the NZD/USD is downward biased, but in the short-term, it’s sideways, in the middle of the August 25-September 1 swing low/high at 0.5886-0.6015, waiting for a clear direction to resume a larger correction. However, if the pair tumbles below 0.5900, expected sellers to pile up and drive prices toward the year-to-date (YTD) low of 0.5886, with further downside seen at the November 3 low of 0.5740. Conversely, a rally to 0.6000 could pave the way for an upward correction, with the 50-day Moving Average (DMA) targeted at 0.6098.
Technical Levels: Supports and Resistances
NZDUSD currently trading at 0.5936 at the time of writing. Pair opened at 0.5946 and is trading with a change of -0.17 % .
| Overview | Overview.1 | |
|---|---|---|
| 0 | Today last price | 0.5936 |
| 1 | Today Daily Change | -0.0010 |
| 2 | Today Daily Change % | -0.1700 |
| 3 | Today daily open | 0.5946 |
The pair remains strongly bearish on the daily time frame. It trades below the 20 SMA @ 0.5969, 50 SMA 0.6103, 100 SMA @ 0.6138 and 200 SMA @ 0.6221.
| Trends | Trends.1 | |
|---|---|---|
| 0 | Daily SMA20 | 0.5969 |
| 1 | Daily SMA50 | 0.6103 |
| 2 | Daily SMA100 | 0.6138 |
| 3 | Daily SMA200 | 0.6221 |
The previous day high was 0.6015 while the previous day low was 0.5934. The daily 38.2% Fib levels comes at 0.5965, expected to provide resistance. Similarly, the daily 61.8% fib level is at 0.5984, expected to provide resistance.
Note the levels of interest below:
- Pivot support is noted at 0.5915, 0.5884, 0.5834
- Pivot resistance is noted at 0.5996, 0.6046, 0.6077
| Levels | Levels.1 |
|---|---|
| Previous Daily High | 0.6015 |
| Previous Daily Low | 0.5934 |
| Previous Weekly High | 0.6015 |
| Previous Weekly Low | 0.5887 |
| Previous Monthly High | 0.6219 |
| Previous Monthly Low | 0.5885 |
| Daily Fibonacci 38.2% | 0.5965 |
| Daily Fibonacci 61.8% | 0.5984 |
| Daily Pivot Point S1 | 0.5915 |
| Daily Pivot Point S2 | 0.5884 |
| Daily Pivot Point S3 | 0.5834 |
| Daily Pivot Point R1 | 0.5996 |
| Daily Pivot Point R2 | 0.6046 |
| Daily Pivot Point R3 | 0.6077 |
[/s2If]
Download Nehcap EAWe have two EAs that are operational on our LIVE accounts.
- EA-FIX: Check out the details here. Download EA-FIX . EA-FIX is a non-grid HFT scalper.
- EA-GROWTH: High quality low dd EA using trend grids. Download EA_GROWTHJoin Our Telegram Group
")


