In the early European session, there are some buyers showing interest in GBPUSD when it goes above the 1.2600 level.
…
This is a premium post.
[s2If !current_user_can(access_s2member_level4)]Please register for FREE REGISTER to read full post below containing analysis. In case of any error or you think you are not able to read the full post below, please email us at support#nehcap.com [lwa][/s2If] [s2If current_user_can(access_s2member_level1)]
- GBP/USD attracts some buyers above the 1.2600 mark in the early European session.
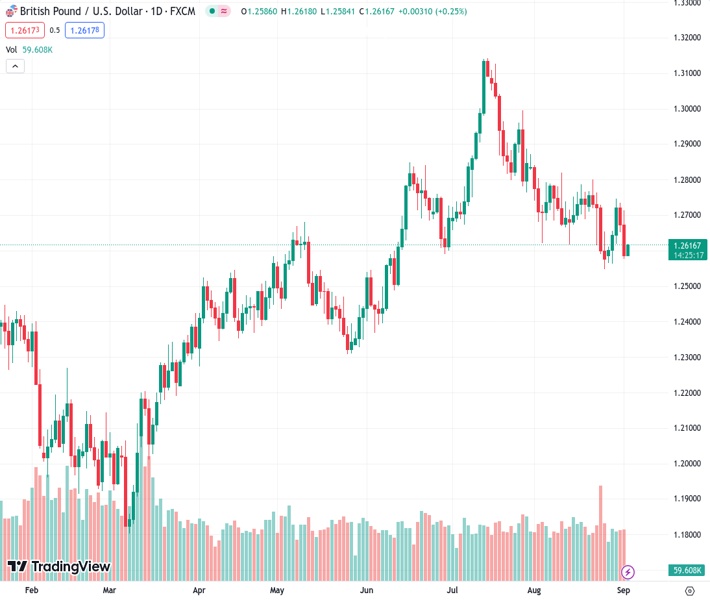
The pair currently trades last at 1.26171.
The previous day high was 1.2713 while the previous day low was 1.2578. The daily 38.2% Fib levels comes at 1.2629, expected to provide resistance. Similarly, the daily 61.8% fib level is at 1.2661, expected to provide resistance.
The GBP/USD pair recovers some recent losses and holds above the 1.2600 mark during the early European session on Monday. The major pair currently trades around 1.2612, gaining 0.17% on the day.
Markets remain subdued due to the Labor Day holiday in the US after a busy week of economic data released. The US Bureau of Labor Statistics revealed on Friday that the US Nonfarm Payrolls (NFP) for August came in at 187K, beating the expectations of 170K and 157K in the previous reading. The Unemployment Rate dropped significantly to 3.8%, compared to the market consensus of 3.5% and 3.5% prior. The monthly Average Hourly Earnings rose by 0.2%, against the estimation of 0.3%. Finally, the US Manufacturing PMI came in at 47.6 versus 46.4 prior and better than 47.0 expected.
Market participants speculate that the Federal Reserve (Fed) might end its cycle of monetary tightening. According to the CME FedWatch tool, the markets have priced in the fact that the Fed will not raise interest rates at its September meeting, and the probability of raising rates in November and December dropped to nearly 35%. Despite posting the lowest weekly gain since the beginning of July, the US Dollar (USD) trades in positive territory for the sixth consecutive week.
On the Pound Sterling front, the data released on Friday indicated that August was the weakest month for British factories since the beginning of the COVID-19 crisis, with orders plunging substantially due to rising interest rates. The S&P Global/CIPS Manufacturing PMI came in at 43.0 In August from 45.3 in July. The figure marked the six consecutive months below the 50 threshold. However, traders anticipate the odds of a 25 basis points (bps) rate hike in the upcoming meeting.
The BoE Chief Economist Huw Pill noted last week that inflation in the United Kingdom remains too high and added that there are several measures in the pipeline. The aggressive tightening of monetary policy by the BoE exerts some pressure on the British Pound considering investors fear the negative impact on the UK economy.
In the absence of the top-tier economic data release from the UK docket and the US holiday. Investors will digest last week’s data ahead of the US ISM Services PMI for August. The figure is expected to rise to 52.6. Investors will take cues from the data and find opportunities around the GBP/USD pair.
Technical Levels: Supports and Resistances
GBPUSD currently trading at 1.2613 at the time of writing. Pair opened at 1.259 and is trading with a change of 0.18 % .
| Overview | Overview.1 | |
|---|---|---|
| 0 | Today last price | 1.2613 |
| 1 | Today Daily Change | 0.0023 |
| 2 | Today Daily Change % | 0.1800 |
| 3 | Today daily open | 1.2590 |
The pair is trading below its 20 Daily moving average @ 1.2693, below its 50 Daily moving average @ 1.2777 , below its 100 Daily moving average @ 1.265 and above its 200 Daily moving average @ 1.2416
| Trends | Trends.1 | |
|---|---|---|
| 0 | Daily SMA20 | 1.2693 |
| 1 | Daily SMA50 | 1.2777 |
| 2 | Daily SMA100 | 1.2650 |
| 3 | Daily SMA200 | 1.2416 |
The previous day high was 1.2713 while the previous day low was 1.2578. The daily 38.2% Fib levels comes at 1.2629, expected to provide resistance. Similarly, the daily 61.8% fib level is at 1.2661, expected to provide resistance.
Note the levels of interest below:
- Pivot support is noted at 1.2541, 1.2491, 1.2405
- Pivot resistance is noted at 1.2676, 1.2762, 1.2812
| Levels | Levels.1 |
|---|---|
| Previous Daily High | 1.2713 |
| Previous Daily Low | 1.2578 |
| Previous Weekly High | 1.2746 |
| Previous Weekly Low | 1.2563 |
| Previous Monthly High | 1.2841 |
| Previous Monthly Low | 1.2548 |
| Daily Fibonacci 38.2% | 1.2629 |
| Daily Fibonacci 61.8% | 1.2661 |
| Daily Pivot Point S1 | 1.2541 |
| Daily Pivot Point S2 | 1.2491 |
| Daily Pivot Point S3 | 1.2405 |
| Daily Pivot Point R1 | 1.2676 |
| Daily Pivot Point R2 | 1.2762 |
| Daily Pivot Point R3 | 1.2812 |
[/s2If]
Download Nehcap EAWe have two EAs that are operational on our LIVE accounts.
- EA-FIX: Check out the details here. Download EA-FIX . EA-FIX is a non-grid HFT scalper.
- EA-GROWTH: High quality low dd EA using trend grids. Download EA_GROWTHJoin Our Telegram Group
")


