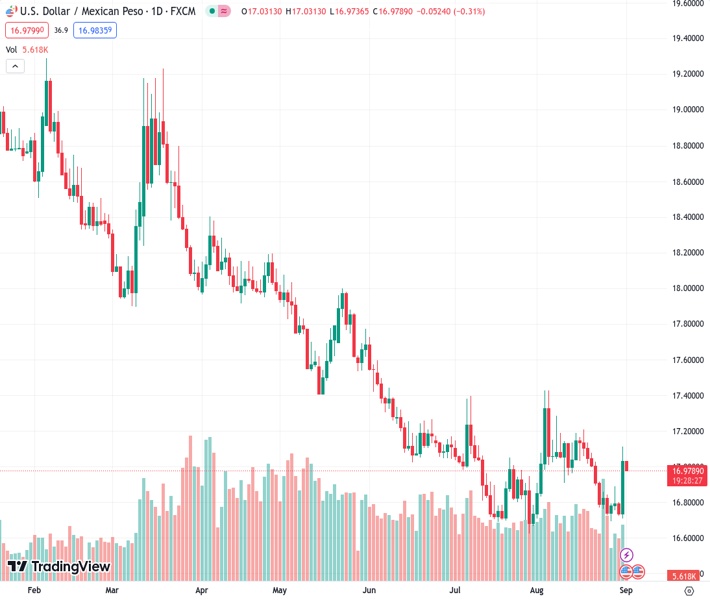
The USDMXN exchange rate at 16.9750 has reduced its largest daily increase in a month but has not displayed recent downward movement. According to Nehcap’s perspective, there is an anticipation of a recovery.
…
This is a premium post.
[s2If !current_user_can(access_s2member_level4)]Please register for FREE REGISTER to read full post below containing analysis. In case of any error or you think you are not able to read the full post below, please email us at support#nehcap.com [lwa][/s2If] [s2If current_user_can(access_s2member_level1)]
- USD/MXN pares the biggest daily gain in a month but lacks downside momentum of late.
The pair currently trades last at 16.9750.
The previous day high was 17.115 while the previous day low was 16.7087. The daily 38.2% Fib levels comes at 16.9598, expected to provide support. Similarly, the daily 61.8% fib level is at 16.8639, expected to provide support.
USD/MXN takes offers to refreshe intraday bottom surrounding 16.98, after reversing from the weekly top, as markets brace for the key US employment report for August on Friday.
USD/MXN rallied the most in a month while refreshing the weekly top on Thursday after it crossed the top line of a five-week-old symmetrical triangle. The bullish breakout also gained support from the MACD signals to renew the multi-day top. However, the nearly overbought RSI and the pre-data positioning seem to weigh on the Mexican Peso (MXN) pair of late.
Even so, a convergence of the 100-SMA and 200-SMA, around 16.94–93, appears a tough nut to crack for the USD/MXN sellers.
Following that, the stated triangle’s top line surrounding 16.87 will be in the spotlight.
Should the USD/MXN bears keep the reins past 16.87, the odds of witnessing a fall toward the rising support line stretched from late July, near 16.70, can’t be ruled out.
On the contrary, the USD/MXN pair’s recovery needs to refresh the weekly top, currently around 17.11, to convince the buyers.
Even so, the mid-August swing high of 17.20 and the previous monthly peak surrounding 17.42 could test the Mexican Peso (MXN) sellers before giving them control.
Trend: Recovery expected
Technical Levels: Supports and Resistances
USDMXN currently trading at 16.9972 at the time of writing. Pair opened at 17.0435 and is trading with a change of -0.27% % .
| Overview | Overview.1 | |
|---|---|---|
| 0 | Today last price | 16.9972 |
| 1 | Today Daily Change | -0.0463 |
| 2 | Today Daily Change % | -0.27% |
| 3 | Today daily open | 17.0435 |
The pair is trading above its 20 Daily moving average @ 16.9812, above its 50 Daily moving average @ 16.9738 , below its 100 Daily moving average @ 17.314 and below its 200 Daily moving average @ 18.076
| Trends | Trends.1 | |
|---|---|---|
| 0 | Daily SMA20 | 16.9812 |
| 1 | Daily SMA50 | 16.9738 |
| 2 | Daily SMA100 | 17.3140 |
| 3 | Daily SMA200 | 18.0760 |
The previous day high was 17.115 while the previous day low was 16.7087. The daily 38.2% Fib levels comes at 16.9598, expected to provide support. Similarly, the daily 61.8% fib level is at 16.8639, expected to provide support.
Note the levels of interest below:
- Pivot support is noted at 16.7964, 16.5494, 16.3901
- Pivot resistance is noted at 17.2028, 17.3621, 17.6092
| Levels | Levels.1 |
|---|---|
| Previous Daily High | 17.1150 |
| Previous Daily Low | 16.7087 |
| Previous Weekly High | 17.0800 |
| Previous Weekly Low | 16.7366 |
| Previous Monthly High | 17.4274 |
| Previous Monthly Low | 16.6945 |
| Daily Fibonacci 38.2% | 16.9598 |
| Daily Fibonacci 61.8% | 16.8639 |
| Daily Pivot Point S1 | 16.7964 |
| Daily Pivot Point S2 | 16.5494 |
| Daily Pivot Point S3 | 16.3901 |
| Daily Pivot Point R1 | 17.2028 |
| Daily Pivot Point R2 | 17.3621 |
| Daily Pivot Point R3 | 17.6092 |
[/s2If]
Download Nehcap EAWe have two EAs that are operational on our LIVE accounts.
- EA-FIX: Check out the details here. Download EA-FIX . EA-FIX is a non-grid HFT scalper.
- EA-GROWTH: High quality low dd EA using trend grids. Download EA_GROWTHJoin Our Telegram Group
")


