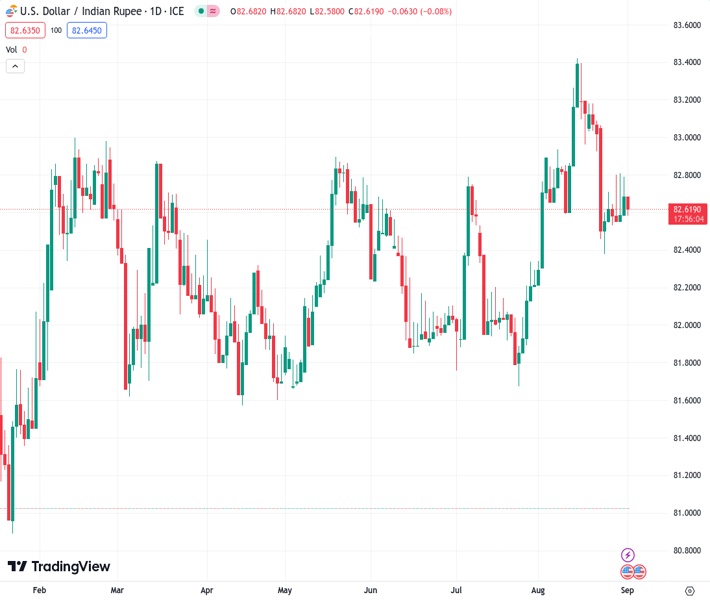
The USDINR exchange rate remains at a low level near the lowest point of the day, preparing for a second straight week of losses.
…
This is a premium post.
[s2If !current_user_can(access_s2member_level4)]Please register for FREE REGISTER to read full post below containing analysis. In case of any error or you think you are not able to read the full post below, please email us at support#nehcap.com [lwa][/s2If] [s2If current_user_can(access_s2member_level1)]
- USD/INR holds lower grounds around intraday bottom, braces for the second consecutive weekly loss.
The pair currently trades last at 82.6390.
The previous day high was 82.8464 while the previous day low was 82.5755. The daily 38.2% Fib levels comes at 82.679, expected to provide resistance. Similarly, the daily 61.8% fib level is at 82.7429, expected to provide resistance.
USD/INR prints a two-day losing streak around 82.60, down 0.15% intraday, as market players brace for the all-important US employment report on Friday. It’s worth noting that the upbeat India growth figures join China-inspired optimism in the Asia-Pacific zone to exert downside pressure on the Indian Rupee (INR) pair ahead of the key US Nonfarm Payrolls (NFP).
India’s second quarter (Q2) Gross Domestic Product (GDP) offered a positive surprise the previous day by rising to 7.8% YoY from 6.1% previous readings and 7.7% market forecasts. Further, the Asian nation’s Infrastructure Output also came in at 8.0% versus 4.2% market forecasts and 8.3% prior (revised).
Elsewhere, the upbeat China manufacturing activity data and stimulus measures also weigh on the USD/INR pair, by cutting the US Dollar’s haven demand due to optimism in the Asia-Pacific zone. That said, China’s Caixin Manufacturing PMI for August rose to 51.0 versus 49.3 market forecasts and 49.2 previous readings. Further, the People’s Bank of China (PBoC) announced early Friday that it will lower the foreign exchange reserve requirement ratio to 4%, from 6.0%, effective from September 15. On the same line, a slew of China banks cut interest rates on Yuan deposits while citing the readiness to ease the pressure from lower mortgage rates, per Reuters. Among them, ICBC, China Industrial Bank, Agricultural Bank of China and Bank of China (BoC) gained major attention.
Talking about the US data, the Fed’s preferred inflation gauge, namely the US Core Personal Consumption Expenditure (PCE) Price Index for August, matched market forecasts of 4.2% YoY and 0.2% MoM versus 4.1% and 0.2% respectively priors. Further, the Initial Jobless Claims dropped to 228K from 232K prior (revised) versus 235K market forecasts while the Chicago Purchasing Managers’ Index rose to 48.7 for August compared to 44.1 expected and 42.8 previous readings. Additionally, Personal Spending rose past the 0.6% expected and previous readings to 0.8% for July whereas Personal Income eased to 0.2% for the said month, from the 0.3% market forecast and prior.
Amid these plays, the MSCI’s Index of Asia-Pacific shares ex-Japan reverses the previous day’s pullback from a three-week high while Indian equity benchmarks are up on a day, backed by heavy gains in China. Further, the US 10-year and two-year Treasury bond yields remain depressed around the lowest level in three weeks while the US stock futures dwindle after a mixed Wall Street close.
Looking forward, USD/INR traders should pay attention to the risk catalysts ahead of the US employment report for August as forecasts suggest the headline US Nonfarm Payrolls (NFP) could ease to 170K. That said, the previously mixed outcomes of the JOLTS Job Openings, ADP Employment Change and Continuing Jobless Claims prod the US Dollar bulls. Additionally, the three-month average of the US NFP halves to 218K versus a year earlier. As a result, the overall scenario of the US job numbers appears downbeat and can only recall the USD/INR buyers by posting an extremely strong outcome of the job numbers.
Also read: Nonfarm Payrolls Preview: Four scenarios for a jobs report set to test US economic resilience
Even if the USD/INR reverses from the 21-DMA upside hurdle surrounding 82.90, a convergence of the 50-DMA and a five-week-old rising support line, close to 82.50 appears a tough nut to crack for the pair sellers.
Technical Levels: Supports and Resistances
USDINR currently trading at 82.5984 at the time of writing. Pair opened at 82.7494 and is trading with a change of -0.18% % .
| Overview | Overview.1 | |
|---|---|---|
| 0 | Today last price | 82.5984 |
| 1 | Today Daily Change | -0.1510 |
| 2 | Today Daily Change % | -0.18% |
| 3 | Today daily open | 82.7494 |
The pair is trading below its 20 Daily moving average @ 82.9065, above its 50 Daily moving average @ 82.4864 , above its 100 Daily moving average @ 82.3474 and above its 200 Daily moving average @ 82.2824
| Trends | Trends.1 | |
|---|---|---|
| 0 | Daily SMA20 | 82.9065 |
| 1 | Daily SMA50 | 82.4864 |
| 2 | Daily SMA100 | 82.3474 |
| 3 | Daily SMA200 | 82.2824 |
The previous day high was 82.8464 while the previous day low was 82.5755. The daily 38.2% Fib levels comes at 82.679, expected to provide resistance. Similarly, the daily 61.8% fib level is at 82.7429, expected to provide resistance.
Note the levels of interest below:
- Pivot support is noted at 82.6011, 82.4528, 82.3302
- Pivot resistance is noted at 82.8721, 82.9948, 83.143
| Levels | Levels.1 |
|---|---|
| Previous Daily High | 82.8464 |
| Previous Daily Low | 82.5755 |
| Previous Weekly High | 83.2100 |
| Previous Weekly Low | 82.3485 |
| Previous Monthly High | 83.5505 |
| Previous Monthly Low | 82.2240 |
| Daily Fibonacci 38.2% | 82.6790 |
| Daily Fibonacci 61.8% | 82.7429 |
| Daily Pivot Point S1 | 82.6011 |
| Daily Pivot Point S2 | 82.4528 |
| Daily Pivot Point S3 | 82.3302 |
| Daily Pivot Point R1 | 82.8721 |
| Daily Pivot Point R2 | 82.9948 |
| Daily Pivot Point R3 | 83.1430 |
[/s2If]
Download Nehcap EAWe have two EAs that are operational on our LIVE accounts.
- EA-FIX: Check out the details here. Download EA-FIX . EA-FIX is a non-grid HFT scalper.
- EA-GROWTH: High quality low dd EA using trend grids. Download EA_GROWTHJoin Our Telegram Group
")


