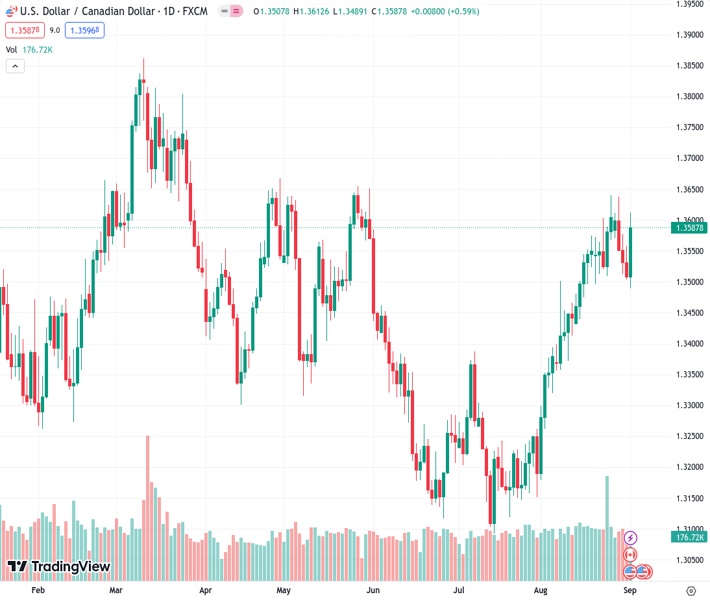
The USDCAD pair is currently trading at a value of 1.35903. The presence of a bullish-engulfing candlestick pattern on the daily chart indicates that the buyers have taken charge of the market.
…
This is a premium post.
[s2If !current_user_can(access_s2member_level4)]Please register for FREE REGISTER to read full post below containing analysis. In case of any error or you think you are not able to read the full post below, please email us at support#nehcap.com [lwa][/s2If] [s2If current_user_can(access_s2member_level1)]
- Bullish-engulfing candlestick pattern on the daily chart suggests buyers are in control.
The pair currently trades last at 1.35903.
The previous day high was 1.3558 while the previous day low was 1.3504. The daily 38.2% Fib levels comes at 1.3525, expected to provide support. Similarly, the daily 61.8% fib level is at 1.3537, expected to provide support.
The Canadian Dollar (CAD) losses ground against the US Dollar (USD) sponsored on weaker than expected Canadian economic growth in the second quarter, alongside a mixed US jobs report and improvements in business activity. Hence, the USD/CAD is trading at 1.3595 after hitting a daily low of 1.3489, above its opening price by 0.65%.
The daily chart portrays the pair as neutral to upward biased, though the major reached a lower low at 1.3489, slightly below the August 8 daily high at 1.3502. However, the USD/CAD recovery was outstanding, forming a bullish-engulfing candlestick chart pattern, which engulfed the price action of the previous two days. Hence, buyers are in charge.
The USD/CAD first resistance would be the 1.3600 figure. A breach of the latter will expose the August 25 high at 1.3640, closely followed by the May 26 swing high at 1.3654 and the April 28 high at 1.3667. Once those levels are cleared, the 1.3700 figure would be up next before rallying towards the March 24 daily high at 1.3804.
Conversely, if the USD/CAD drops below 1.3489, the pair could shift downwards and extend its losses toward the 200-day Moving Average (DMA) at 1.3462. Once cleared, the next stop would be the psychological 1.3400 area, and up next, the 50-DMA at 1.3345.
Technical Levels: Supports and Resistances
USDCAD currently trading at 1.3594 at the time of writing. Pair opened at 1.3509 and is trading with a change of 0.63 % .
| Overview | Overview.1 | |
|---|---|---|
| 0 | Today last price | 1.3594 |
| 1 | Today Daily Change | 0.0085 |
| 2 | Today Daily Change % | 0.6300 |
| 3 | Today daily open | 1.3509 |
The pair remains strongly bullish on the daily timeframe. It trades above its 20 SMA @ 1.3503, 50 SMA 1.3338, 100 SMA @ 1.3394 and 200 SMA @ 1.3462.
| Trends | Trends.1 | |
|---|---|---|
| 0 | Daily SMA20 | 1.3503 |
| 1 | Daily SMA50 | 1.3338 |
| 2 | Daily SMA100 | 1.3394 |
| 3 | Daily SMA200 | 1.3462 |
The previous day high was 1.3558 while the previous day low was 1.3504. The daily 38.2% Fib levels comes at 1.3525, expected to provide support. Similarly, the daily 61.8% fib level is at 1.3537, expected to provide support.
Note the levels of interest below:
- Pivot support is noted at 1.3489, 1.347, 1.3436
- Pivot resistance is noted at 1.3543, 1.3577, 1.3596
| Levels | Levels.1 |
|---|---|
| Previous Daily High | 1.3558 |
| Previous Daily Low | 1.3504 |
| Previous Weekly High | 1.3640 |
| Previous Weekly Low | 1.3496 |
| Previous Monthly High | 1.3640 |
| Previous Monthly Low | 1.3184 |
| Daily Fibonacci 38.2% | 1.3525 |
| Daily Fibonacci 61.8% | 1.3537 |
| Daily Pivot Point S1 | 1.3489 |
| Daily Pivot Point S2 | 1.3470 |
| Daily Pivot Point S3 | 1.3436 |
| Daily Pivot Point R1 | 1.3543 |
| Daily Pivot Point R2 | 1.3577 |
| Daily Pivot Point R3 | 1.3596 |
[/s2If]
Download Nehcap EAWe have two EAs that are operational on our LIVE accounts.
- EA-FIX: Check out the details here. Download EA-FIX . EA-FIX is a non-grid HFT scalper.
- EA-GROWTH: High quality low dd EA using trend grids. Download EA_GROWTHJoin Our Telegram Group
")


