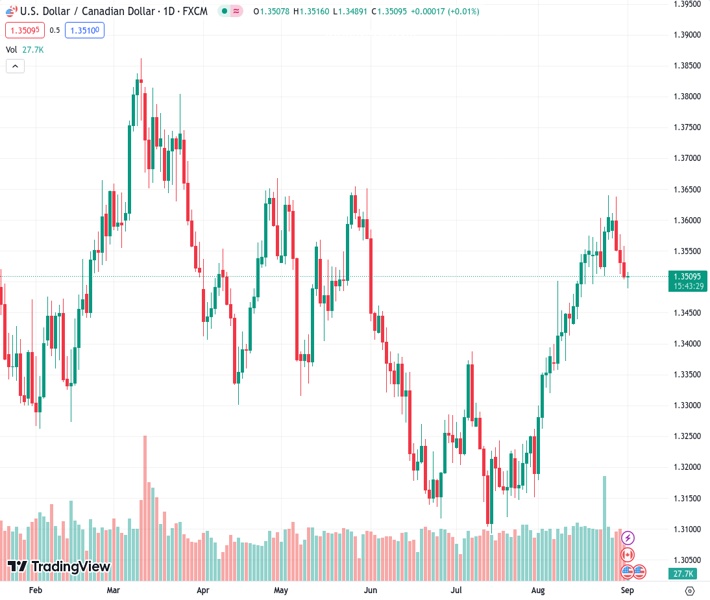
The USDCAD pair, currently at 1.35095, is experiencing a lack of clear guidance, and this has resulted in a four-day losing streak. This lack of direction is the lowest the pair has experienced in two weeks.
…
This is a premium post.
[s2If !current_user_can(access_s2member_level4)]Please register for FREE REGISTER to read full post below containing analysis. In case of any error or you think you are not able to read the full post below, please email us at support#nehcap.com [lwa][/s2If] [s2If current_user_can(access_s2member_level1)]
- USD/CAD lacks clear directions at the lowest levels in two weeks, prods four-day losing streak.
The pair currently trades last at 1.35095.
The previous day high was 1.3558 while the previous day low was 1.3504. The daily 38.2% Fib levels comes at 1.3525, expected to provide resistance. Similarly, the daily 61.8% fib level is at 1.3537, expected to provide resistance.
USD/CAD stays defensive around 1.3510 while bouncing off the lowest level in a fortnight heading into Friday’s European session. In doing so, the Loonie pair fails to cheer the firmer prices of Canada’s main export item WTI crude oil as traders brace for the US employment and Canadian growth figures.
The overall US Dollar rebound and the market’s preparations for top-tier data failed to stop the USD/CAD bears the previous day as the WTI crude oil reached a multi-day high. Also exerting downside pressure on the pair could be the sharp revision in the Canadian Current Account data for the first quarter (Q1) of 2023.
That said, WTI crude oil rose for the fourth consecutive day to $83.40 while refreshing a three-week high amid a slew of measures from China to defend the economy from slipping back into COVID-like days. Among them, the People’s Bank of China’s (PBoC) 2.0% cut to the foreign reserve ratio and a reduction of the Yuan deposit rates by a slew of Chinese banks gained major attention. That said, adverse weather conditions, Hurricane Idalia in the US and China’s Typhoon fear join the heavy inventory draw in the US to propel the Oil price.
Elsewhere, the US Dollar Index (DXY) struggles to defend the previous day’s rebound from the 200-DMA around 103.60. That said, the quote rallied the most in a week on Thursday as most data from the US pushed back the previously dovish bias about the Federal Reserve (Fed). On the same line were comments from Atlanta Fed President Raphael Bostic as he advocated the “higher for longer rates” policy.
It should be noted that the the Fed’s preferred inflation gauge, namely the US Core Personal Consumption Expenditure (PCE) Price Index for August, matched market forecasts of 4.2% YoY and 0.2% MoM versus 4.1% and 0.2% respectively priors. Further, the Initial Jobless Claims dropped to 228K from 232K prior (revised) versus 235K market forecasts while the Chicago Purchasing Managers’ Index rose to 48.7 for August compared to 44.1 expected and 42.8 previous readings. Additionally, Personal Spending rose past the 0.6% expected and previous readings to 0.8% for July whereas Personal Income eased to 0.2% for the said month, from 0.3% market forecast and prior.
Moving on, the USD/CAD traders should pay attention to the risk catalysts ahead of the second quarter (Q2) and July month Gross Domestic Product (GDP) from Canada, as well as the US employment report for August.
It should be noted that the overall scenario of the US job numbers appears downbeat and hence a strong US NFP becomes necessary for the USD/CAD bulls to return.
USD/CAD flirts with the 21-DMA support of around 1.3500 after reversing from a downward-sloping resistance line from late April, close to 1.3610 by the press time. That said, bearish MACD signals, downbeat RSI and the failure to break the key resistance line direct the Loonie pair toward the 200-DMA, near 1.3460 at the latest.
Technical Levels: Supports and Resistances
USDCAD currently trading at 1.3511 at the time of writing. Pair opened at 1.3509 and is trading with a change of 0.01% % .
| Overview | Overview.1 | |
|---|---|---|
| 0 | Today last price | 1.3511 |
| 1 | Today Daily Change | 0.0002 |
| 2 | Today Daily Change % | 0.01% |
| 3 | Today daily open | 1.3509 |
The pair remains strongly bullish on the daily timeframe. It trades above its 20 SMA @ 1.3503, 50 SMA 1.3338, 100 SMA @ 1.3394 and 200 SMA @ 1.3462.
| Trends | Trends.1 | |
|---|---|---|
| 0 | Daily SMA20 | 1.3503 |
| 1 | Daily SMA50 | 1.3338 |
| 2 | Daily SMA100 | 1.3394 |
| 3 | Daily SMA200 | 1.3462 |
The previous day high was 1.3558 while the previous day low was 1.3504. The daily 38.2% Fib levels comes at 1.3525, expected to provide resistance. Similarly, the daily 61.8% fib level is at 1.3537, expected to provide resistance.
Note the levels of interest below:
- Pivot support is noted at 1.3489, 1.347, 1.3436
- Pivot resistance is noted at 1.3543, 1.3577, 1.3596
| Levels | Levels.1 |
|---|---|
| Previous Daily High | 1.3558 |
| Previous Daily Low | 1.3504 |
| Previous Weekly High | 1.3640 |
| Previous Weekly Low | 1.3496 |
| Previous Monthly High | 1.3640 |
| Previous Monthly Low | 1.3184 |
| Daily Fibonacci 38.2% | 1.3525 |
| Daily Fibonacci 61.8% | 1.3537 |
| Daily Pivot Point S1 | 1.3489 |
| Daily Pivot Point S2 | 1.3470 |
| Daily Pivot Point S3 | 1.3436 |
| Daily Pivot Point R1 | 1.3543 |
| Daily Pivot Point R2 | 1.3577 |
| Daily Pivot Point R3 | 1.3596 |
[/s2If]
Download Nehcap EAWe have two EAs that are operational on our LIVE accounts.
- EA-FIX: Check out the details here. Download EA-FIX . EA-FIX is a non-grid HFT scalper.
- EA-GROWTH: High quality low dd EA using trend grids. Download EA_GROWTHJoin Our Telegram Group
")


