The US Dollar does not initially gain strength from the varied Nonfarm Payrolls data, but the improved sentiment is supported by the ISM Manufacturing PMI.
…
This is a premium post.
[s2If !current_user_can(access_s2member_level4)]Please register for FREE REGISTER to read full post below containing analysis. In case of any error or you think you are not able to read the full post below, please email us at support#nehcap.com [lwa][/s2If] [s2If current_user_can(access_s2member_level1)]
- Mixed US Nonfarm Payrolls data initially fails to boost USD, but ISM Manufacturing PMI lifts sentiment.
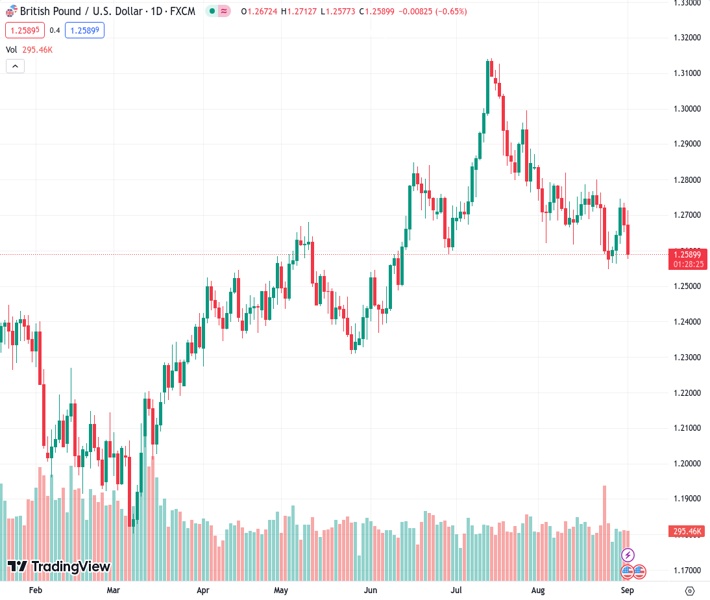
The pair currently trades last at 1.25894.
The previous day high was 1.2735 while the previous day low was 1.2653. The daily 38.2% Fib levels comes at 1.2684, expected to provide resistance. Similarly, the daily 61.8% fib level is at 1.2703, expected to provide resistance.
The Pound Sterling (GBP) slumped late in the New York session versus the Greenback (USD) as US Treasury bond yields rose and bolstered the USD, which is set to print its seven consecutive week printing gains. The GBP/USD hit a daily high of 1.2712 before reversing its course and diving toward the current exchange rate, trading at around 1.2590s.
Financial markets have remained calm after a busy week in the US economic landscape. The August Nonfarm Payrolls data showed a mix, with 187,000 jobs added, beating the 177,000 estimate. However, the rise in the Unemployment rate to 3.8% YoY, above the forecasted 3.5%, surprisingly didn’t boost the US Dollar. Investors speculate that the Federal Reserve might delay tightening monetary conditions in September, leading to reduced bets on rate hikes by November.
Consequently, the GBP/USD initially surged towards its daily peak. However, a business activity report surpassing expectations triggered a reversal, causing the Pound to relinquish those gains. The ISM Manufacturing PMI increased from 46.4 to 47.6 in August, exceeding the projected 47. Most subcomponents of the report improved, indicating a more optimistic perspective on business activity in the US.
Another reason that underpinned the buck was US bond yields recovering some lost ground, which underpinned the US Dollar Index (DXY) back above the 104.000 figure, a tailwind for the USD/CHF pair.
Earlier data in the UK showed that British business activity remained in contractionary territory, dropping for six consecutive months below the 50 threshold, as revealed by the S^&P Global/CIPS Manufacturing PMI, coming at 43.0 from 45.3 in July. That makes the case for a Bank of England (BoE) pause on its tightening cycle, but inflation remains close to 7%. Nevertheless, traders foresee a 25 bps rate increase in the upcoming meeting.
However, there is a silver lining. The Office for National Statistics has revised its assessment of the UK economy, indicating that it was 0.6% larger in the fourth quarter of 2021 than in the final quarter of 2019. This contrasts with the prior estimate of a 1.2% reduction in size.
The daily chart portrays the pair as neutral to downward biased, but it could shift downward if the GBP/USD achieves a daily close below the June 29 low of 1.2590. Once cleared, the next support would be an upslope trendline drawn from May lows at around 1.2550/75, followed by the August 23 swing low of 1.2548. A decisive break and the pair could test the 200-day Moving Average (DMA) at 1.2414. Upside risks lie at the August 30 daily high at 1.2746, shy of the 50-DMA at 1.2774.
Technical Levels: Supports and Resistances
GBPUSD currently trading at 1.2593 at the time of writing. Pair opened at 1.2673 and is trading with a change of -0.63 % .
| Overview | Overview.1 | |
|---|---|---|
| 0 | Today last price | 1.2593 |
| 1 | Today Daily Change | -0.0080 |
| 2 | Today Daily Change % | -0.6300 |
| 3 | Today daily open | 1.2673 |
The pair is trading below its 20 Daily moving average @ 1.2701, below its 50 Daily moving average @ 1.2779 , below its 100 Daily moving average @ 1.2648 and above its 200 Daily moving average @ 1.2413
| Trends | Trends.1 | |
|---|---|---|
| 0 | Daily SMA20 | 1.2701 |
| 1 | Daily SMA50 | 1.2779 |
| 2 | Daily SMA100 | 1.2648 |
| 3 | Daily SMA200 | 1.2413 |
The previous day high was 1.2735 while the previous day low was 1.2653. The daily 38.2% Fib levels comes at 1.2684, expected to provide resistance. Similarly, the daily 61.8% fib level is at 1.2703, expected to provide resistance.
Note the levels of interest below:
- Pivot support is noted at 1.2639, 1.2605, 1.2557
- Pivot resistance is noted at 1.2721, 1.2769, 1.2803
| Levels | Levels.1 |
|---|---|
| Previous Daily High | 1.2735 |
| Previous Daily Low | 1.2653 |
| Previous Weekly High | 1.2800 |
| Previous Weekly Low | 1.2548 |
| Previous Monthly High | 1.2841 |
| Previous Monthly Low | 1.2548 |
| Daily Fibonacci 38.2% | 1.2684 |
| Daily Fibonacci 61.8% | 1.2703 |
| Daily Pivot Point S1 | 1.2639 |
| Daily Pivot Point S2 | 1.2605 |
| Daily Pivot Point S3 | 1.2557 |
| Daily Pivot Point R1 | 1.2721 |
| Daily Pivot Point R2 | 1.2769 |
| Daily Pivot Point R3 | 1.2803 |
[/s2If]
Download Nehcap EAWe have two EAs that are operational on our LIVE accounts.
- EA-FIX: Check out the details here. Download EA-FIX . EA-FIX is a non-grid HFT scalper.
- EA-GROWTH: High quality low dd EA using trend grids. Download EA_GROWTHJoin Our Telegram Group
")


