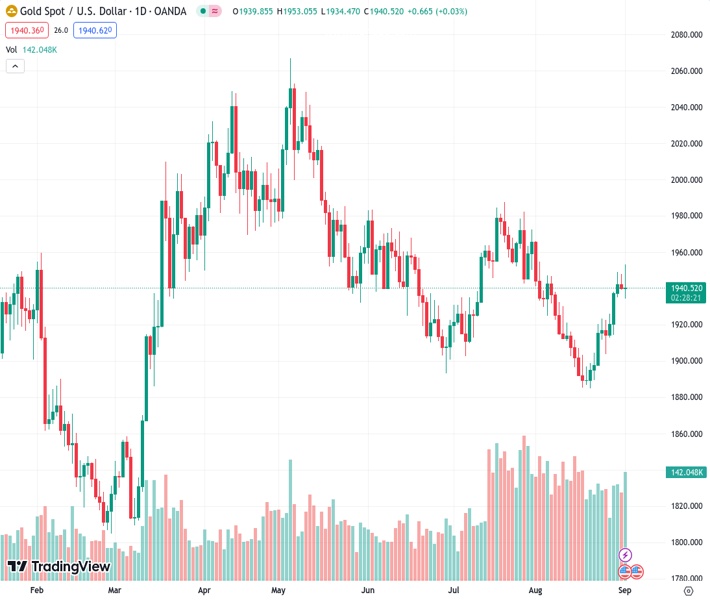
The price of #XAUUSD, which was initially at 1,940.35, increased to its highest point of $1,952 for the day but was later declined by the 100-day SMA, causing it to fall back to $1,940.
…
This is a premium post.
[s2If !current_user_can(access_s2member_level4)]Please register for FREE REGISTER to read full post below containing analysis. In case of any error or you think you are not able to read the full post below, please email us at support#nehcap.com [lwa][/s2If] [s2If current_user_can(access_s2member_level1)]
- XAU/USD rose to a daily high of $1,952 and then got rejected by 100-day SMA, retreating to $1,940.
The pair currently trades last at 1940.35.
The previous day high was 1947.95 while the previous day low was 1939.15. The daily 38.2% Fib levels comes at 1942.51, expected to provide resistance. Similarly, the daily 61.8% fib level is at 1944.59, expected to provide resistance.
At the end of the week, the Gold spot price XAU/USD erased daily gains, retreating towards the $1,940 area. After initially retreating, the US yields recovered during the American session, but still the yellow metal will set a winning week of more than 1%.
The highly anticipated US Nonfarm Payrolls report from August showed mixed figures. On a positive note the headline’s NFPs rose to 187,000, higher than the 170,000 expected and the previous 157,000. Average Hourly Earnings came in soft, increasing by 0.2% MoM vs. the 0.3% expected. Unemployment rose to 3.8% in the same month, against all forecasts.
Regarding economic activity, the Institute for Supply Management (ISM) Manufacturing PMI figures from the United States came in above the consensus in August, with the actual figure coming in at 47.6, higher than the expected figure of 47 from the previous 46.4.
The US bond yields, often seen as the opportunity cost of holding gold, were volatile following the employment and economic activity figures. The 2-year yield dropped to a three-week low around the 4.76% area, settling at 4.85%. Likewise, the 5 and 10-year yields dropped to their lowest level since August 10 and settled at 4.27% and 4.15%, respectively. Regarding the next Federal Reserve (Fed) expectations, markets lowered their bets for an additional hike in 2023. According to the CME FedWatch tool, investors are still confident that the Fed won’t hike in the September meeting, and the odds of a hike in November and December dropped to nearly 35%
According to the daily chart, the technical outlook for XAU/USD leans neutral to bearish as signs of bullish exhaustion emerge. The Relative Strength Index (RSI) displays a negative slope above its midline, and the Moving Average Convergence Divergence (MACD) shows fading green bars. With a downward trend below its midline, the Relative Strength Index (RSI) suggests a bearish sentiment, while the Moving Average Convergence (MACD) displays weaker green bars. On the other hand, the pair is below the 100-day Simple Moving Averages (SMAs) but above the 20 and 200-day averages, suggesting that the buyers may still have some gas left in the tank.
Support levels: $1,930, $1,915 (20 and 200-day SMA convergence), $1,900.
Resistance levels: $1,950 (100-day SMA), $1,970, $2,000.
Technical Levels: Supports and Resistances
XAUUSD currently trading at 1941.21 at the time of writing. Pair opened at 1940.14 and is trading with a change of 0.06 % .
| Overview | Overview.1 | |
|---|---|---|
| 0 | Today last price | 1941.21 |
| 1 | Today Daily Change | 1.07 |
| 2 | Today Daily Change % | 0.06 |
| 3 | Today daily open | 1940.14 |
The pair is trading above its 20 Daily moving average @ 1915.27, above its 50 Daily moving average @ 1930.89 , below its 100 Daily moving average @ 1954.94 and above its 200 Daily moving average @ 1913.95
| Trends | Trends.1 | |
|---|---|---|
| 0 | Daily SMA20 | 1915.27 |
| 1 | Daily SMA50 | 1930.89 |
| 2 | Daily SMA100 | 1954.94 |
| 3 | Daily SMA200 | 1913.95 |
The previous day high was 1947.95 while the previous day low was 1939.15. The daily 38.2% Fib levels comes at 1942.51, expected to provide resistance. Similarly, the daily 61.8% fib level is at 1944.59, expected to provide resistance.
Note the levels of interest below:
- Pivot support is noted at 1936.88, 1933.61, 1928.08
- Pivot resistance is noted at 1945.68, 1951.21, 1954.48
| Levels | Levels.1 |
|---|---|
| Previous Daily High | 1947.95 |
| Previous Daily Low | 1939.15 |
| Previous Weekly High | 1923.43 |
| Previous Weekly Low | 1884.85 |
| Previous Monthly High | 1966.08 |
| Previous Monthly Low | 1884.85 |
| Daily Fibonacci 38.2% | 1942.51 |
| Daily Fibonacci 61.8% | 1944.59 |
| Daily Pivot Point S1 | 1936.88 |
| Daily Pivot Point S2 | 1933.61 |
| Daily Pivot Point S3 | 1928.08 |
| Daily Pivot Point R1 | 1945.68 |
| Daily Pivot Point R2 | 1951.21 |
| Daily Pivot Point R3 | 1954.48 |
[/s2If]
Download Nehcap EAWe have two EAs that are operational on our LIVE accounts.
- EA-FIX: Check out the details here. Download EA-FIX . EA-FIX is a non-grid HFT scalper.
- EA-GROWTH: High quality low dd EA using trend grids. Download EA_GROWTHJoin Our Telegram Group
")


