The initial impact of the mixed US Nonfarm Payrolls data failed to strengthen the USD, but the positive sentiment was later boosted by the ISM Manufacturing PMI.
…
This is a premium post.
[s2If !current_user_can(access_s2member_level4)]Please register for FREE REGISTER to read full post below containing analysis. In case of any error or you think you are not able to read the full post below, please email us at support#nehcap.com [lwa][/s2If] [s2If current_user_can(access_s2member_level1)]
- Mixed US Nonfarm Payrolls data initially fails to boost USD, but ISM Manufacturing PMI lifts sentiment.
The pair currently trades last at 0.88527.
The previous day high was 0.8846 while the previous day low was 0.8772. The daily 38.2% Fib levels comes at 0.8818, expected to provide support. Similarly, the daily 61.8% fib level is at 0.88, expected to provide support.
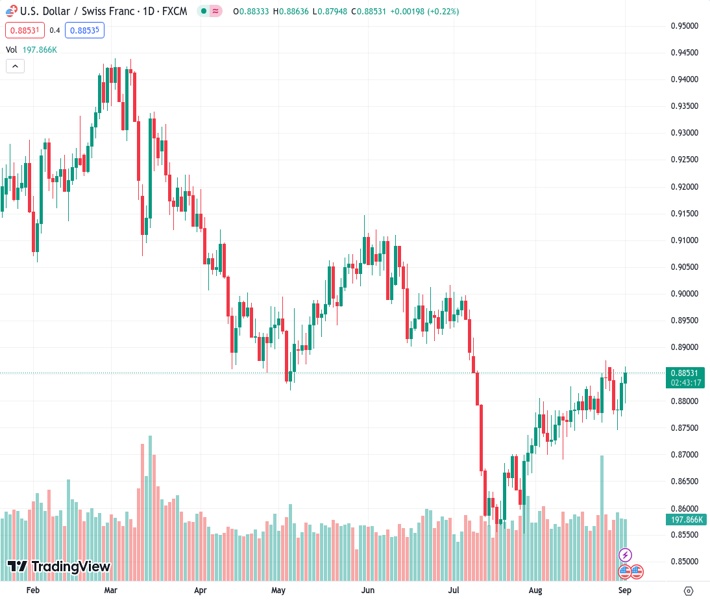
The Swiss Franc (CHF) losses traction against the American Dollar (USD) in the mid-New York session on Friday after a tranche of economic data from the United States (US) bolstered the USD. The USD/CHF dived towards a daily low of 0.8795 before resuming its latest three-day uptrend and exchanging hands at around 0.8850s, above its opening price by 0.28%.
The financial markets remain calm after a busy week in the US economic docket. August’s Nonfarm Payrolls figures came mixed, with the US economy adding 187K jobs, above estimates of 177K, which surprisingly failed to boos the Greenback, as the Unemployment rate rose by 3.8% YoY, above forecasts of 3.5%. The US Dollar weakness was because investors speculated the Fed would not tighten monetary conditions on September, while reducing bets the US central bank would do it by November.
However, USD/CHF sellers were caught off guard, as the ISM Manufacturing PMI improved to 47.6 from 46.4 in July and topped expectations of 47. Most of the subcomponents of the report strengthened, painting a more positive outlook for business activity in the US.
Another reason that underpinned the buck was US bond yields recovering some lost ground, which underpinned the US Dollar Index (DXY) back above the 104.000 figure, a tailwind for the USD/CHF pair.
In Switzerland, inflation rose by 1.6%, exceeded estimates of 1.5%, and was unchanged compared to July’s figures. Although the data reinforces the chances for additional tightening by the Swiss National Bank (SNB), a worse than expected Retail Sales report in July could deter the central bank from tightening monetary policy. Traders should be aware the SNB’s current interest rate sits at 1.75%, and chances for keeping them unchanged loom 70%.
Given the backdrop, the USD/CHF could resume its uptrend and test the 0.9000 figure, but the upcoming US Federal Reserve meeting on September 14 can shift the perspective ahead of the Fed’s decision.
The USD/CHF daily chart portrays the pair as entering a consolidation phase, though tilted to the upside, once buyers reclaimed the 50-day Moving Average (DMA) at 0.8782. In addition, the major has crossed above a downslope resistance trendline drawn from March 2023 highs, a five-month-old relevant trendline, which, once broken, the pair would have a straightforward way to test 0.9000. A breach of the latter will expose the confluence of a previous support trendline turned resistance and the 200-DMA at around 0.9040/65 before buyers set their sights on the May 31 high of 0.9147. Contrarily, downside risks emerge below the current week’s low of 0.8744.
Technical Levels: Supports and Resistances
USDCHF currently trading at 0.8855 at the time of writing. Pair opened at 0.8834 and is trading with a change of 0.24 % .
| Overview | Overview.1 | |
|---|---|---|
| 0 | Today last price | 0.8855 |
| 1 | Today Daily Change | 0.0021 |
| 2 | Today Daily Change % | 0.2400 |
| 3 | Today daily open | 0.8834 |
The pair is trading above its 20 Daily moving average @ 0.879, above its 50 Daily moving average @ 0.8786 , below its 100 Daily moving average @ 0.8882 and below its 200 Daily moving average @ 0.907
| Trends | Trends.1 | |
|---|---|---|
| 0 | Daily SMA20 | 0.8790 |
| 1 | Daily SMA50 | 0.8786 |
| 2 | Daily SMA100 | 0.8882 |
| 3 | Daily SMA200 | 0.9070 |
The previous day high was 0.8846 while the previous day low was 0.8772. The daily 38.2% Fib levels comes at 0.8818, expected to provide support. Similarly, the daily 61.8% fib level is at 0.88, expected to provide support.
Note the levels of interest below:
- Pivot support is noted at 0.8788, 0.8742, 0.8714
- Pivot resistance is noted at 0.8863, 0.8892, 0.8938
| Levels | Levels.1 |
|---|---|
| Previous Daily High | 0.8846 |
| Previous Daily Low | 0.8772 |
| Previous Weekly High | 0.8876 |
| Previous Weekly Low | 0.8760 |
| Previous Monthly High | 0.8876 |
| Previous Monthly Low | 0.8690 |
| Daily Fibonacci 38.2% | 0.8818 |
| Daily Fibonacci 61.8% | 0.8800 |
| Daily Pivot Point S1 | 0.8788 |
| Daily Pivot Point S2 | 0.8742 |
| Daily Pivot Point S3 | 0.8714 |
| Daily Pivot Point R1 | 0.8863 |
| Daily Pivot Point R2 | 0.8892 |
| Daily Pivot Point R3 | 0.8938 |
[/s2If]
Download Nehcap EAWe have two EAs that are operational on our LIVE accounts.
- EA-FIX: Check out the details here. Download EA-FIX . EA-FIX is a non-grid HFT scalper.
- EA-GROWTH: High quality low dd EA using trend grids. Download EA_GROWTHJoin Our Telegram Group
")


