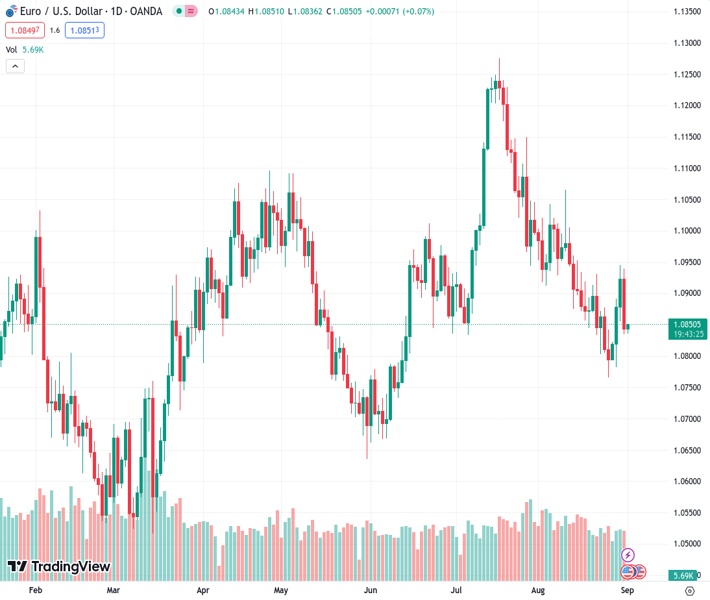
The exchange rate between the Euro and the US Dollar, currently at 1.08497, is experiencing a consecutive decline for the second day in a row due to various influences.
…
This is a premium post.
[s2If !current_user_can(access_s2member_level4)]Please register for FREE REGISTER to read full post below containing analysis. In case of any error or you think you are not able to read the full post below, please email us at support#nehcap.com [lwa][/s2If] [s2If current_user_can(access_s2member_level1)]
- EUR/USD edges lower for the second straight day and is pressured by a combination of factors.
The pair currently trades last at 1.08497.
The previous day high was 1.094 while the previous day low was 1.0835. The daily 38.2% Fib levels comes at 1.0875, expected to provide resistance. Similarly, the daily 61.8% fib level is at 1.09, expected to provide resistance.
The EUR/USD pair remains on the defensive for the second successive day on Friday and trades below mid-1.0800s, representing the 200-hour Simple Moving Average (SMA) through the Asian session. The fundamental backdrop, meanwhile, favours bearish traders and supports prospects for an extension of the overnight sharp retracement slide from the vicinity of a two-and-half-week top, around the 1.0945 region touched on Wednesday.
The shared currency is weighed down by cautious comments by European Central Bank (ECB) officials on Thursday, which lifted bets for an on-hold decision at the September policy meeting. In fact, Isabel Schnabel, who is considered one of the most hawkish members of the ECB, noted that Euro Zone growth was weaker than predicted, though that does not necessarily void the need for more rate hikes. Adding to this, ECB Vice-President Luis de Guindos said that the central bank is nearing the end of its hiking rate cycle but the decision on whether to further tighten its monetary policy at its next meeting in two weeks is still open for debate.
This comes on the back of the Euro Zone data showing a moderation in underlying price growth in August and boosts expectations that the ECB will keep interest rates unchanged. According to the official figures released by Eurostat, the annual Euro Zone Harmonised Index of Consumer Prices (HICP) held steady at 5.3% in August against the 5.1% expected. The Core HICP, however, eased to 5.3% YoY in August from 5.5% in the previous month, matching consensus estimates. In contrast, inflation in the US, as measured by the change in the Personal Consumption Expenditures (PCE) Price Index, rose to 3.3% YoY in July from the 3% previous.
Furthermore, the annual Core PCE Price Index – the Federal Reserve’s preferred gauge of inflation – rose 4.2%, a slightly stronger pace than the 4.1% increase recorded in June. Additional details of the report showed that Personal Income grew 0.2%, while Personal Spending rose 0.8% on a monthly basis – the strongest print since January. The data keeps the door for one more 25 bps Fed rate hike move by the end of this year, which assists the US Treasury bond yields to stall the recent pullback from a multi-year peak. This, in turn, underpins the US Dollar and supports prospects for a further depreciating move for the EUR/USD pair.
That said, other data released earlier this week – the ADP report and the second estimate of the US Q2 GDP print – indicated that the resilient US economy has already started losing steam. This might force the Fed to soften its hawkish stance, which, in turn, is holding back the USD bulls from placing aggressive bets and limiting the downside for the EUR/USD pair. Market participants also seem reluctant and prefer to wait on the sidelines ahead of the closely-watched US monthly jobs data. The popularly known NFP report is due for release later during the early North American session and provides some meaningful impetus to the major.
Technical Levels: Supports and Resistances
EURUSD currently trading at 1.0838 at the time of writing. Pair opened at 1.0844 and is trading with a change of -0.06 % .
| Overview | Overview.1 | |
|---|---|---|
| 0 | Today last price | 1.0838 |
| 1 | Today Daily Change | -0.0006 |
| 2 | Today Daily Change % | -0.0600 |
| 3 | Today daily open | 1.0844 |
The pair is trading below its 20 Daily moving average @ 1.0899, below its 50 Daily moving average @ 1.097 , below its 100 Daily moving average @ 1.0924 and above its 200 Daily moving average @ 1.0814
| Trends | Trends.1 | |
|---|---|---|
| 0 | Daily SMA20 | 1.0899 |
| 1 | Daily SMA50 | 1.0970 |
| 2 | Daily SMA100 | 1.0924 |
| 3 | Daily SMA200 | 1.0814 |
The previous day high was 1.094 while the previous day low was 1.0835. The daily 38.2% Fib levels comes at 1.0875, expected to provide resistance. Similarly, the daily 61.8% fib level is at 1.09, expected to provide resistance.
Note the levels of interest below:
- Pivot support is noted at 1.0806, 1.0768, 1.0702
- Pivot resistance is noted at 1.091, 1.0977, 1.1015
| Levels | Levels.1 |
|---|---|
| Previous Daily High | 1.0940 |
| Previous Daily Low | 1.0835 |
| Previous Weekly High | 1.0930 |
| Previous Weekly Low | 1.0766 |
| Previous Monthly High | 1.1065 |
| Previous Monthly Low | 1.0766 |
| Daily Fibonacci 38.2% | 1.0875 |
| Daily Fibonacci 61.8% | 1.0900 |
| Daily Pivot Point S1 | 1.0806 |
| Daily Pivot Point S2 | 1.0768 |
| Daily Pivot Point S3 | 1.0702 |
| Daily Pivot Point R1 | 1.0910 |
| Daily Pivot Point R2 | 1.0977 |
| Daily Pivot Point R3 | 1.1015 |
[/s2If]
Download Nehcap EAWe have two EAs that are operational on our LIVE accounts.
- EA-FIX: Check out the details here. Download EA-FIX . EA-FIX is a non-grid HFT scalper.
- EA-GROWTH: High quality low dd EA using trend grids. Download EA_GROWTHJoin Our Telegram Group
")


