The EURSEK currency pair reached its highest level in three days on Friday at a rate of 11.8802, but did not experience any significant continuation in its upward movement.
…
This is a premium post.
[s2If !current_user_can(access_s2member_level4)]Please register for FREE REGISTER to read full post below containing analysis. In case of any error or you think you are not able to read the full post below, please email us at support#nehcap.com [lwa][/s2If] [s2If current_user_can(access_s2member_level1)]
- EUR/SEK touches a three-day high on Friday, albeit lacks follow-through.
The pair currently trades last at 11.8802.
The previous day high was 11.8958 while the previous day low was 11.8153. The daily 38.2% Fib levels comes at 11.865, expected to provide support. Similarly, the daily 61.8% fib level is at 11.8461, expected to provide support.
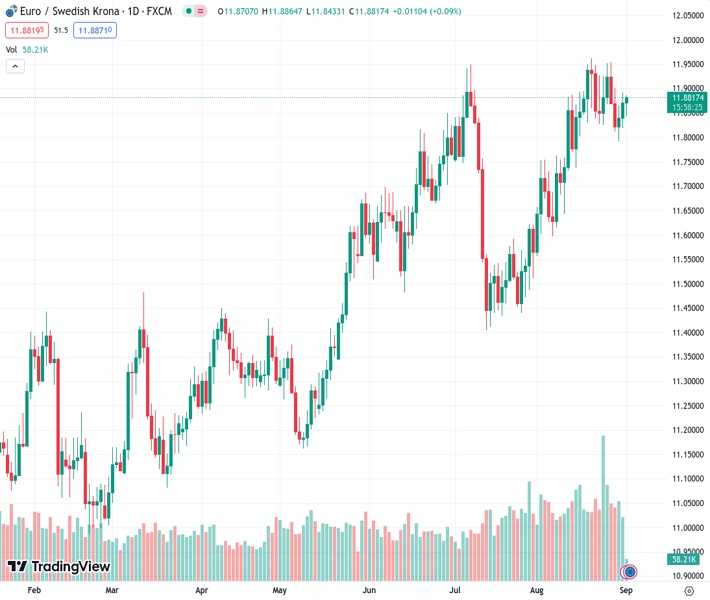
The EUR/SEK pair edges higher for the third straight day on Friday and touches a three-day high level of 11.8978 during the Asian session, albeit lacks bullish conviction.
From a technical perspective, the recent repeated failures ahead of the 12.00 round figure constitute the formation of a bearish multiple-top pattern on the daily chart. The EUR/SEK pair, however, has been showing some resilience below a previous strong resistance breakpoint, now turned support around the 11.80 region, which should now act as a pivotal point.
Meanwhile, oscillators on the daily chart are still holding in the bullish territory and have again started gaining positive traction on the 4-hour chart. This further makes it prudent to wait for strong follow-through selling and acceptance below the 11.80 area before traders start positioning for any meaningful corrective decline from the all-time peak touched in August.
The EUR/SEK pair might then accelerate the downfall towards the 11.7500 horizontal zone en route to the 11.7050 area. This is followed by support near the 11.6600 level, which if broken decisively will suggest that spot prices have topped out in the near term and set the stage for a further depreciating move.
On the flip side, bulls need to wait for a convincing breakout through the multiple-top barrier near the 11.95 region before placing fresh bets. The EUR/SEK pair might then prolong its well-established uptrend from the July swing low, around the 11.40 area.
Technical Levels: Supports and Resistances
EURSEK currently trading at 11.8875 at the time of writing. Pair opened at 11.877 and is trading with a change of 0.09 % .
| Overview | Overview.1 | |
|---|---|---|
| 0 | Today last price | 11.8875 |
| 1 | Today Daily Change | 0.0105 |
| 2 | Today Daily Change % | 0.0900 |
| 3 | Today daily open | 11.8770 |
The pair remains strongly bullish on the daily timeframe. It trades above its 20 SMA @ 11.8265, 50 SMA 11.7275, 100 SMA @ 11.5932 and 200 SMA @ 11.3769.
| Trends | Trends.1 | |
|---|---|---|
| 0 | Daily SMA20 | 11.8265 |
| 1 | Daily SMA50 | 11.7275 |
| 2 | Daily SMA100 | 11.5932 |
| 3 | Daily SMA200 | 11.3769 |
The previous day high was 11.8958 while the previous day low was 11.8153. The daily 38.2% Fib levels comes at 11.865, expected to provide support. Similarly, the daily 61.8% fib level is at 11.8461, expected to provide support.
Note the levels of interest below:
- Pivot support is noted at 11.8296, 11.7822, 11.7491
- Pivot resistance is noted at 11.9101, 11.9432, 11.9906
| Levels | Levels.1 |
|---|---|
| Previous Daily High | 11.8958 |
| Previous Daily Low | 11.8153 |
| Previous Weekly High | 11.9646 |
| Previous Weekly Low | 11.7798 |
| Previous Monthly High | 11.9664 |
| Previous Monthly Low | 11.4122 |
| Daily Fibonacci 38.2% | 11.8650 |
| Daily Fibonacci 61.8% | 11.8461 |
| Daily Pivot Point S1 | 11.8296 |
| Daily Pivot Point S2 | 11.7822 |
| Daily Pivot Point S3 | 11.7491 |
| Daily Pivot Point R1 | 11.9101 |
| Daily Pivot Point R2 | 11.9432 |
| Daily Pivot Point R3 | 11.9906 |
[/s2If]
Download Nehcap EAWe have two EAs that are operational on our LIVE accounts.
- EA-FIX: Check out the details here. Download EA-FIX . EA-FIX is a non-grid HFT scalper.
- EA-GROWTH: High quality low dd EA using trend grids. Download EA_GROWTHJoin Our Telegram Group
")


