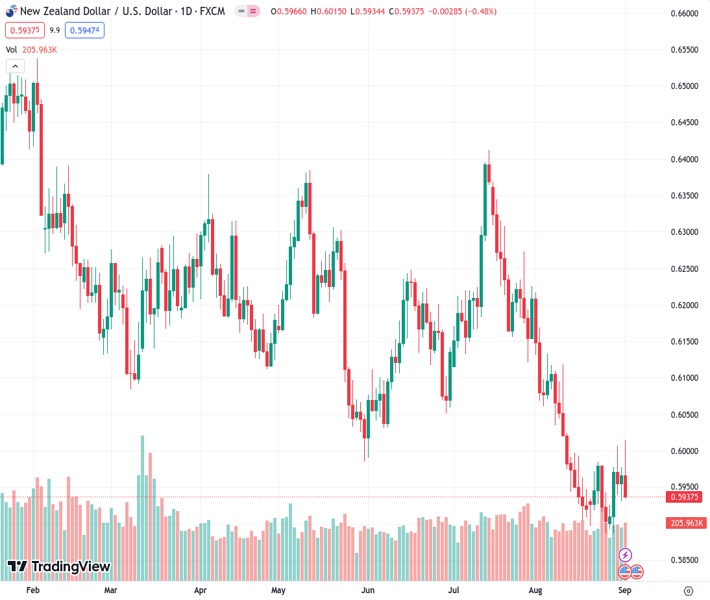
The currency pair NZDUSD, at a rate of 0.59372, reached its highest value of the day at 0.6015 before sharply decreasing to 0.5940.
…
This is a premium post.
[s2If !current_user_can(access_s2member_level4)]Please register for FREE REGISTER to read full post below containing analysis. In case of any error or you think you are not able to read the full post below, please email us at support#nehcap.com [lwa][/s2If] [s2If current_user_can(access_s2member_level1)]
- NZD/USD peaked at a daily high of 0.6015 and then plummeted to 0.5940.
The pair currently trades last at 0.59372.
The previous day high was 0.5978 while the previous day low was 0.593. The daily 38.2% Fib levels comes at 0.596, expected to provide resistance. Similarly, the daily 61.8% fib level is at 0.5948, expected to provide resistance.
At the end of the week, the USD measured by the DXY index tallies daily gains after volatility seen in the markets after the release of August Nonfarm Payrolls and ISM PMI manufacturing figures. Still, the NZD/USD pair will record a weekly 0.70% increase. No relevant data was released on the Kiwi’s side.
The Nonfarm Payrolls from the US from August came a tick higher than expected at 187,000 vs. the 170,000 expected and from its previous downwardly revised 157,000. As per the Average Hourly Earning, wages increased by 0.2% (MoM), lower than the 0.3% expected, and the unemployment rate unexpectedly rose to 3.8%. Other data showed that the Institute for Supply Management (ISM) reported higher than anticipated PMIs, with the manufacturing index at 47.6, higher than the 47 expected. The Employment index also came strong at 48.5 but remains in contraction territory.
The USD saw volatility against its rivals as the mixed NFP report initially fuelled a sell-off, but after the ISM PMI, the Greenback somewhat recovered. The US Treasury yields saw the same movement, hinting that the markets are betting on a less aggressive Fed and investors hoping the tightening cycle ends as the labour market hinted at some softness. Focus now shifts to September 13, when the US will release the August Consumer Price Index (CPI) figures, which will be necessary for the next Fed decision expectations.
The daily chart analysis indicates a neutral to a bearish outlook for NZD/USD, as the bears show signs of taking control but still face challenges ahead. Having turned flat in negative territory, the Relative Strength Index (RSI) suggests a potential market equilibrium with balanced selling and buying pressure. At the same time, the Moving Average Convergence (MACD) lays out stagnant green bars. On the other hand, the pair is below the 20,100 and 200-day Simple Moving Averages (SMAs), suggesting that the bears are firmly in control of the bigger picture.
Support levels:0.5930, 0.5900, 0.5880.
Resistance levels: 0.5967 (20-day SMA), 0.5980, 0.6000.
Technical Levels: Supports and Resistances
NZDUSD currently trading at 0.5942 at the time of writing. Pair opened at 0.5967 and is trading with a change of -0.42 % .
| Overview | Overview.1 | |
|---|---|---|
| 0 | Today last price | 0.5942 |
| 1 | Today Daily Change | -0.0025 |
| 2 | Today Daily Change % | -0.4200 |
| 3 | Today daily open | 0.5967 |
The pair remains strongly bearish on the daily time frame. It trades below the 20 SMA @ 0.5976, 50 SMA 0.6106, 100 SMA @ 0.614 and 200 SMA @ 0.6222.
| Trends | Trends.1 | |
|---|---|---|
| 0 | Daily SMA20 | 0.5976 |
| 1 | Daily SMA50 | 0.6106 |
| 2 | Daily SMA100 | 0.6140 |
| 3 | Daily SMA200 | 0.6222 |
The previous day high was 0.5978 while the previous day low was 0.593. The daily 38.2% Fib levels comes at 0.596, expected to provide resistance. Similarly, the daily 61.8% fib level is at 0.5948, expected to provide resistance.
Note the levels of interest below:
- Pivot support is noted at 0.5939, 0.591, 0.5891
- Pivot resistance is noted at 0.5987, 0.6006, 0.6035
| Levels | Levels.1 |
|---|---|
| Previous Daily High | 0.5978 |
| Previous Daily Low | 0.5930 |
| Previous Weekly High | 0.5987 |
| Previous Weekly Low | 0.5885 |
| Previous Monthly High | 0.6219 |
| Previous Monthly Low | 0.5885 |
| Daily Fibonacci 38.2% | 0.5960 |
| Daily Fibonacci 61.8% | 0.5948 |
| Daily Pivot Point S1 | 0.5939 |
| Daily Pivot Point S2 | 0.5910 |
| Daily Pivot Point S3 | 0.5891 |
| Daily Pivot Point R1 | 0.5987 |
| Daily Pivot Point R2 | 0.6006 |
| Daily Pivot Point R3 | 0.6035 |
[/s2If]
Download Nehcap EAWe have two EAs that are operational on our LIVE accounts.
- EA-FIX: Check out the details here. Download EA-FIX . EA-FIX is a non-grid HFT scalper.
- EA-GROWTH: High quality low dd EA using trend grids. Download EA_GROWTHJoin Our Telegram Group
")


