Gold price is having difficulty taking advantage of its small increase during the day to reach the $1,945 range on Friday.
…
This is a premium post.
[s2If !current_user_can(access_s2member_level4)]Please register for FREE REGISTER to read full post below containing analysis. In case of any error or you think you are not able to read the full post below, please email us at support#nehcap.com [lwa][/s2If] [s2If current_user_can(access_s2member_level1)]
- Gold price struggles to capitalize on its modest intraday uptick to the $1,945 area on Friday.
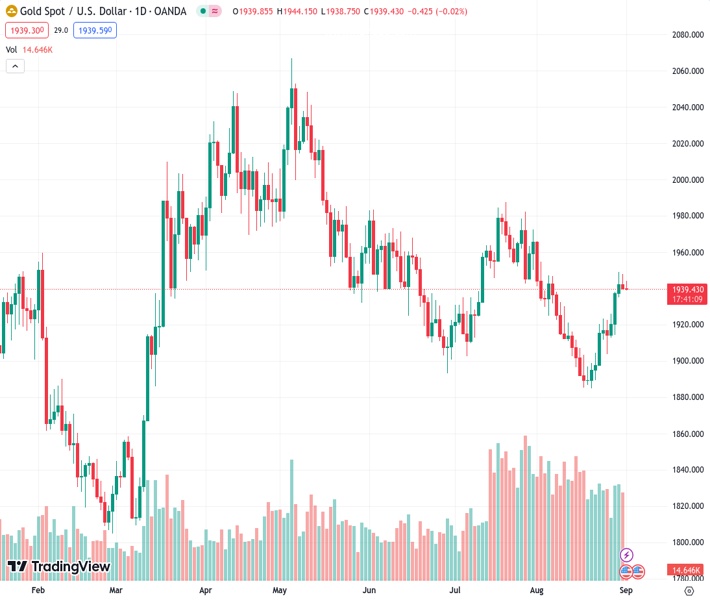
The pair currently trades last at 1939.47.
The previous day high was 1947.95 while the previous day low was 1939.15. The daily 38.2% Fib levels comes at 1942.51, expected to provide resistance. Similarly, the daily 61.8% fib level is at 1944.59, expected to provide resistance.
Gold price attracts fresh sellers following an Asian session uptick to the $1,944 region on Friday and hits a fresh daily low in the last hour, albeit lacks follow-through. The XAU/USD currently trades just below the $1,940 level, nearly unchanged for the day, as traders keenly await the closely-watched monthly employment details from the United States (US) before placing fresh directional bets.
The popularly known Non-Farm Payrolls (NFP) report is due for release later during the early North American session and will influence expectations about the Federal Reserve’s (Fed) next policy move. This, in turn, will determine the near-term trajectory for the US Dollar (USD) and provide some meaningful impetus to the Gold price. In the meantime, the uncertainty over the Fed’s future rate-hike path fails to assist the USD to capitalize on the overnight rebound from a two-week low and acts as a tailwind for the US Dollar-denominated commodity.
It is worth recalling that the US macro data released earlier this week – the ADP report and the second estimate of the US Q2 GDP print – indicated the resilient US economy might be starting to lose steam. This, in turn, fueled speculations that the Fed might be forced to soften its hawkish stance sooner rather than later. That said, the US Personal Consumption Expenditures (PCE) Price Index on Thursday keeps the door open for one more 25 bps lift-off in 2023 and triggers an intraday USD short-covering move from the 200-day Simple Moving Average (SMA).
Meanwhile, the view that the Fed will keep interest rates higher for longer helps the US Treasury bond yields to stall the recent pullback from a multi-year peak. This, along with a generally positive tone around the US equity futures, further contributes to capping the upside for the non-yielding Gold price ahead of the key US data risk. Hence, it will be prudent to wait for strong follow-through buying before positioning for an extension of the recent strong recovery from the $1,885 region, or the lowest level since March 13 touched earlier this month.
Technical Levels: Supports and Resistances
XAUUSD currently trading at 1940.58 at the time of writing. Pair opened at 1940.14 and is trading with a change of 0.02 % .
| Overview | Overview.1 | |
|---|---|---|
| 0 | Today last price | 1940.58 |
| 1 | Today Daily Change | 0.44 |
| 2 | Today Daily Change % | 0.02 |
| 3 | Today daily open | 1940.14 |
The pair is trading above its 20 Daily moving average @ 1915.27, above its 50 Daily moving average @ 1930.89 , below its 100 Daily moving average @ 1954.94 and above its 200 Daily moving average @ 1913.95
| Trends | Trends.1 | |
|---|---|---|
| 0 | Daily SMA20 | 1915.27 |
| 1 | Daily SMA50 | 1930.89 |
| 2 | Daily SMA100 | 1954.94 |
| 3 | Daily SMA200 | 1913.95 |
The previous day high was 1947.95 while the previous day low was 1939.15. The daily 38.2% Fib levels comes at 1942.51, expected to provide resistance. Similarly, the daily 61.8% fib level is at 1944.59, expected to provide resistance.
Note the levels of interest below:
- Pivot support is noted at 1936.88, 1933.61, 1928.08
- Pivot resistance is noted at 1945.68, 1951.21, 1954.48
| Levels | Levels.1 |
|---|---|
| Previous Daily High | 1947.95 |
| Previous Daily Low | 1939.15 |
| Previous Weekly High | 1923.43 |
| Previous Weekly Low | 1884.85 |
| Previous Monthly High | 1966.08 |
| Previous Monthly Low | 1884.85 |
| Daily Fibonacci 38.2% | 1942.51 |
| Daily Fibonacci 61.8% | 1944.59 |
| Daily Pivot Point S1 | 1936.88 |
| Daily Pivot Point S2 | 1933.61 |
| Daily Pivot Point S3 | 1928.08 |
| Daily Pivot Point R1 | 1945.68 |
| Daily Pivot Point R2 | 1951.21 |
| Daily Pivot Point R3 | 1954.48 |
[/s2If]
Download Nehcap EAWe have two EAs that are operational on our LIVE accounts.
- EA-FIX: Check out the details here. Download EA-FIX . EA-FIX is a non-grid HFT scalper.
- EA-GROWTH: High quality low dd EA using trend grids. Download EA_GROWTHJoin Our Telegram Group
")


