For the fifth day in a row during Friday’s Asian session, the USDCAD currency pair has been causing a decline in interest from sellers.
…
This is a premium post.
[s2If !current_user_can(access_s2member_level4)]Please register for FREE REGISTER to read full post below containing analysis. In case of any error or you think you are not able to read the full post below, please email us at support#nehcap.com [lwa][/s2If] [s2If current_user_can(access_s2member_level1)]
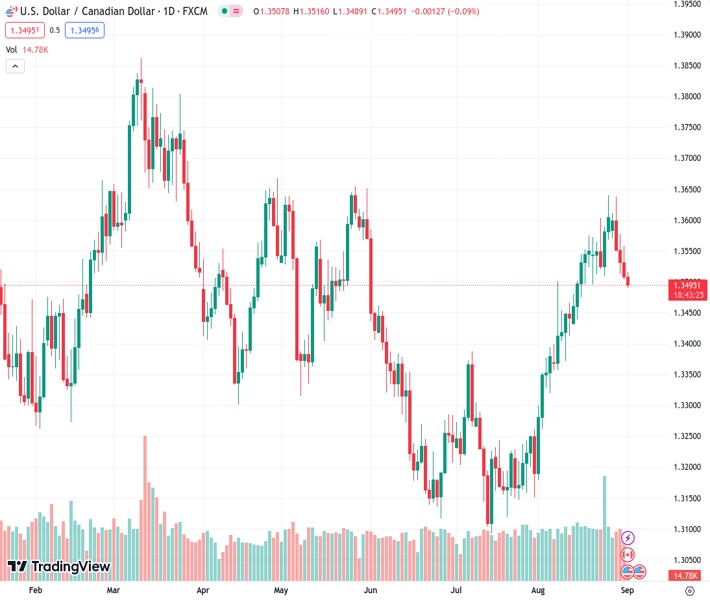
- USD/CAD attracts some sellers for the fifth consecutive day during Friday’s Asian session.
The pair currently trades last at 1.34929.
The previous day high was 1.3558 while the previous day low was 1.3504. The daily 38.2% Fib levels comes at 1.3525, expected to provide resistance. Similarly, the daily 61.8% fib level is at 1.3537, expected to provide resistance.
The USD/CAD pair loses traction and breaks below the 1.3500 area during the early Asian session on Friday. Market players await the highly-anticipated US Nonfarm Payrolls and Canadian Gross Domestic Product (GDP) for the second quarter. The annual growth number is expected to grow 1.2% from the previous reading and the US economy is expected to create 170K jobs in August. The pair currently trades around 1.3495, losing 0.10% on the day.
Fed Chairman Jerome Powell stated at the Jackson Hole Symposium last week that a potential additional rate hike would be depending on incoming data. However, the mixed economic data from the US on Thursday might challenge the Fed to keep rates higher for longer.
On Thursday, US Initial Claims for the week ending of August 25 fell to 228K, falling short of the market consensus of 232 K. The figure marked the lowest level in four weeks while Continuing Claims reached their highest level in six weeks. Additionally, the Federal Reserve’s preferred gauge of inflation, the US Core Personal Consumption Expenditure (PCE) Price Index improved to 4.2% in July from 4.1% in the previous and line with expectations. In response to the data, the Greenback weakened against the Loonie.
On the Loonie front, Statistics Canada reported on Thursday that the nation’s Current Account for the second quarter (Q2) deficit narrowed to C$ 6.63 billion from C$3.17 billion deficit in the previous quarter. Meanwhile, a rise in oil price lifts the Canadian Dollar against its rivals as Canada is the largest exporter of crude to the US.
Market participants will keep an eye on the Canadian Gross Domestic Product (GDP) for the second quarter due later in the day. On the US docket, the US Nonfarm Payrolls will be the closely watched event. The US economy is expected to create 170K jobs in August. Also, the Unemployment Rate and ISM Manufacturing PMI will be released later on Friday. These figures could give a clear direction for the USD/CAD pair.
Technical Levels: Supports and Resistances
USDCAD currently trading at 1.3496 at the time of writing. Pair opened at 1.3509 and is trading with a change of -0.1 % .
| Overview | Overview.1 | |
|---|---|---|
| 0 | Today last price | 1.3496 |
| 1 | Today Daily Change | -0.0013 |
| 2 | Today Daily Change % | -0.1000 |
| 3 | Today daily open | 1.3509 |
The pair is trading below its 20 Daily moving average @ 1.3503, above its 50 Daily moving average @ 1.3338 , above its 100 Daily moving average @ 1.3394 and above its 200 Daily moving average @ 1.3462
| Trends | Trends.1 | |
|---|---|---|
| 0 | Daily SMA20 | 1.3503 |
| 1 | Daily SMA50 | 1.3338 |
| 2 | Daily SMA100 | 1.3394 |
| 3 | Daily SMA200 | 1.3462 |
The previous day high was 1.3558 while the previous day low was 1.3504. The daily 38.2% Fib levels comes at 1.3525, expected to provide resistance. Similarly, the daily 61.8% fib level is at 1.3537, expected to provide resistance.
Note the levels of interest below:
- Pivot support is noted at 1.3489, 1.347, 1.3436
- Pivot resistance is noted at 1.3543, 1.3577, 1.3596
| Levels | Levels.1 |
|---|---|
| Previous Daily High | 1.3558 |
| Previous Daily Low | 1.3504 |
| Previous Weekly High | 1.3640 |
| Previous Weekly Low | 1.3496 |
| Previous Monthly High | 1.3640 |
| Previous Monthly Low | 1.3184 |
| Daily Fibonacci 38.2% | 1.3525 |
| Daily Fibonacci 61.8% | 1.3537 |
| Daily Pivot Point S1 | 1.3489 |
| Daily Pivot Point S2 | 1.3470 |
| Daily Pivot Point S3 | 1.3436 |
| Daily Pivot Point R1 | 1.3543 |
| Daily Pivot Point R2 | 1.3577 |
| Daily Pivot Point R3 | 1.3596 |
[/s2If]
Download Nehcap EAWe have two EAs that are operational on our LIVE accounts.
- EA-FIX: Check out the details here. Download EA-FIX . EA-FIX is a non-grid HFT scalper.
- EA-GROWTH: High quality low dd EA using trend grids. Download EA_GROWTHJoin Our Telegram Group
")


