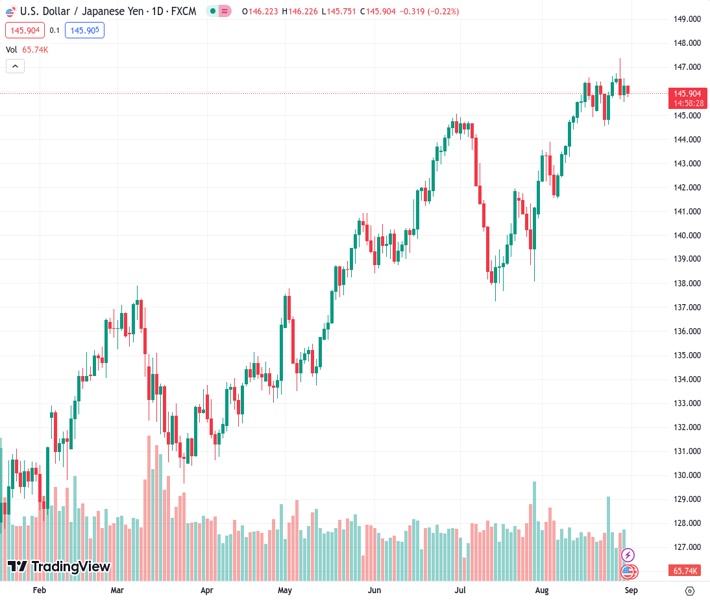
The USDJPY currency pair, trading at 145.906, experiences a decline in momentum near the 145.90 level, but remains above the important 100-hour Exponential Moving Average (EMA).
…
This is a premium post.
[s2If !current_user_can(access_s2member_level4)]Please register for FREE REGISTER to read full post below containing analysis. In case of any error or you think you are not able to read the full post below, please email us at support#nehcap.com [lwa][/s2If] [s2If current_user_can(access_s2member_level1)]
- USD/JPY loses momentum around 145.90, stands above the key 100-hour EMA.
The pair currently trades last at 145.906.
The previous day high was 146.54 while the previous day low was 145.56. The daily 38.2% Fib levels comes at 146.16, expected to provide resistance. Similarly, the daily 61.8% fib level is at 145.93, expected to provide resistance.
The USD/JPY pair attracts some sellers during the early European session on Thursday. The major currently trades around 145.90, losing 0.23% on the day. Markets turn cautious ahead of the release of the US Personal Consumption Expenditures (PCE) Price Index, the Federal Reserve (Fed) preferred gauge of inflation.
Furthermore, Bank of Japan (BoJ) Board member Toyoaki Nakamura stated on Thursday that policymakers need more time to transition to monetary tightening. The remark renews hawkish concerns about BoJ and exerts pressure on the USD/JPY pair.
About the data, the Japanese Retail Sales rose by 6.8% YoY in July versus 5.6% prior, better than the expectation of 5.4%. Meanwhile, the nation’s Industrial Production dropped by 2.0% MoM in July from a rise of 2.4% in the previous month, compared to market consensus of a 1.4% drop.
According to the four-hour chart, the USD/JPY pair stands above the key 100-hour Exponential Moving Averages (EMAs) with an upward slope, which supports the buyers for the time being. However, the Relative Strength Index (RSI) stands in bearish territory below 50, indicating that the further downside cannot be ruled out.
The immediate resistance level for USD/JPY appears at 146.30 (the midline of the Bollinger Band). Any meaningful follow-through buying will see a rally to the boundary of the Bollinger Band and a psychological round mark at the 146.90-147.00 region. Further north, the next barrier to watch for USD/JPY is at a Year-To-Date (YTD) high of 147.37, followed by 147.55 (a high of November 2022) and 148.00 (a round figure).
On the flip side, the first support level is located near a lower limit of the Bollinger Band at 145.70. The next contention level is seen at 145.30 (100-hour EMA). Any intraday pullback below the latter would expose the next critical downside stop at 145.00 (a psychological round mark) and finally at 144.55 (a low of August 23).
Technical Levels: Supports and Resistances
USDJPY currently trading at 145.95 at the time of writing. Pair opened at 146.24 and is trading with a change of -0.2 % .
| Overview | Overview.1 | |
|---|---|---|
| 0 | Today last price | 145.95 |
| 1 | Today Daily Change | -0.29 |
| 2 | Today Daily Change % | -0.20 |
| 3 | Today daily open | 146.24 |
The pair remains strongly bullish on the daily timeframe. It trades above its 20 SMA @ 145.01, 50 SMA 143.13, 100 SMA @ 140.27 and 200 SMA @ 136.76.
| Trends | Trends.1 | |
|---|---|---|
| 0 | Daily SMA20 | 145.01 |
| 1 | Daily SMA50 | 143.13 |
| 2 | Daily SMA100 | 140.27 |
| 3 | Daily SMA200 | 136.76 |
The previous day high was 146.54 while the previous day low was 145.56. The daily 38.2% Fib levels comes at 146.16, expected to provide resistance. Similarly, the daily 61.8% fib level is at 145.93, expected to provide resistance.
Note the levels of interest below:
- Pivot support is noted at 145.69, 145.13, 144.71
- Pivot resistance is noted at 146.67, 147.09, 147.65
| Levels | Levels.1 |
|---|---|
| Previous Daily High | 146.54 |
| Previous Daily Low | 145.56 |
| Previous Weekly High | 146.64 |
| Previous Weekly Low | 144.54 |
| Previous Monthly High | 144.91 |
| Previous Monthly Low | 137.24 |
| Daily Fibonacci 38.2% | 146.16 |
| Daily Fibonacci 61.8% | 145.93 |
| Daily Pivot Point S1 | 145.69 |
| Daily Pivot Point S2 | 145.13 |
| Daily Pivot Point S3 | 144.71 |
| Daily Pivot Point R1 | 146.67 |
| Daily Pivot Point R2 | 147.09 |
| Daily Pivot Point R3 | 147.65 |
[/s2If]
Download Nehcap EAWe have two EAs that are operational on our LIVE accounts.
- EA-FIX: Check out the details here. Download EA-FIX . EA-FIX is a non-grid HFT scalper.
- EA-GROWTH: High quality low dd EA using trend grids. Download EA_GROWTHJoin Our Telegram Group
")


