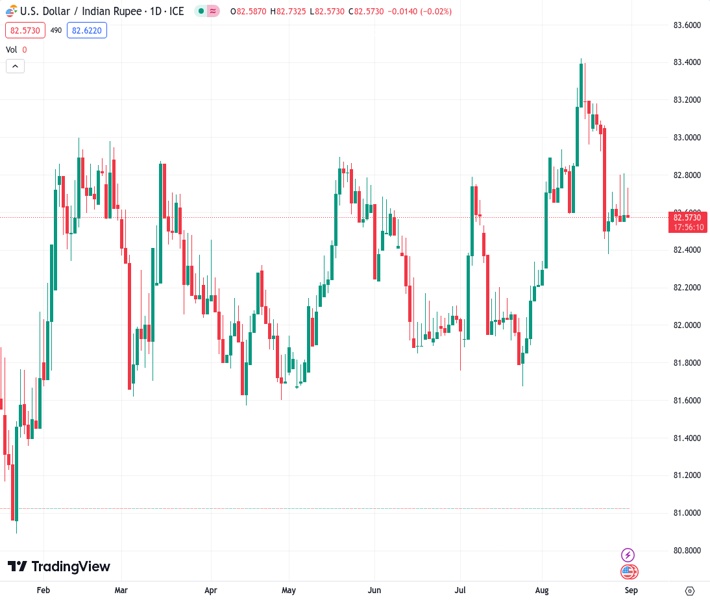
The USDINR exchange rate remains close to 82.60 before the release of India’s economic data.
…
This is a premium post.
[s2If !current_user_can(access_s2member_level4)]Please register for FREE REGISTER to read full post below containing analysis. In case of any error or you think you are not able to read the full post below, please email us at support#nehcap.com [lwa][/s2If] [s2If current_user_can(access_s2member_level1)]
- USD/INR hovers around 82.60 ahead of India’s economic data release.
The pair currently trades last at 82.5800.
The previous day high was 82.8544 while the previous day low was 82.4635. The daily 38.2% Fib levels comes at 82.705, expected to provide resistance. Similarly, the daily 61.8% fib level is at 82.6128, expected to provide resistance.
USD/INR consolidates around 82.60 during the Asian session on Thursday as market participants prepare for upcoming data releases from India and the United States (US). As said, India’s Gross Domestic Product (GDP) is set to be released later in the day. On the US docket, notably the Personal Consumption Expenditures (PCE) and Initial Jobless Claims (Aug 25) will be released during the North American session.
Investors will likely monitor these datasets to have a clearer insight into shaping the strategies before placing fresh bets on the USD/INR pair. According to a Reuters poll, India’s GDP for the April-June quarter is anticipated to have grown by 7.7%. This rate of expansion is deemed the fastest annual pace in a year, attributed to robust growth in the service sector, higher demand and elevated government spending.
The USD/INR pair exhibited strength in previous sessions, yet it trimmed some of its gains due to the optimistic sentiment prevailing in the Asian regional markets. This sentiment was influenced by China’s economic stimulus measures and disappointing economic data from the US. Chinese authorities have recently expressed their disapproval of complaints made by US Commerce Secretary Gina Raimondo regarding challenges faced by American companies operating in China.
US Dollar Index (DXY) is struggling to break a three-day period of losses and is currently trading around 103.10 as of the time of writing. On Wednesday, the DXY marked its two-week low below 103.00 level. The Greenback experiences losses, primarily due to downbeat US economic data and the decreasing yields on US Treasury bonds. In the previous session, the yield on a 10-year US bond dropped to a low of 4.08% and is presently trading at 4.11%.
Following the recent soft Job Openings data from the previous Tuesday, the August ADP National Employment reported a hiring figure of 177K jobs added to the economy. This contrasts with the expected 195K and the 371K jobs added in July. Preliminary Gross Domestic Product (GDP) declined to 2.1% from the previous reading of 2.4%, which was expected to remain consistent.
Technical Levels: Supports and Resistances
USDINR currently trading at 82.6417 at the time of writing. Pair opened at 82.8464 and is trading with a change of -0.25 % .
| Overview | Overview.1 | |
|---|---|---|
| 0 | Today last price | 82.6417 |
| 1 | Today Daily Change | -0.2047 |
| 2 | Today Daily Change % | -0.2500 |
| 3 | Today daily open | 82.8464 |
The pair is trading below its 20 Daily moving average @ 82.9105, above its 50 Daily moving average @ 82.4696 , above its 100 Daily moving average @ 82.3368 and above its 200 Daily moving average @ 82.2772
| Trends | Trends.1 | |
|---|---|---|
| 0 | Daily SMA20 | 82.9105 |
| 1 | Daily SMA50 | 82.4696 |
| 2 | Daily SMA100 | 82.3368 |
| 3 | Daily SMA200 | 82.2772 |
The previous day high was 82.8544 while the previous day low was 82.4635. The daily 38.2% Fib levels comes at 82.705, expected to provide resistance. Similarly, the daily 61.8% fib level is at 82.6128, expected to provide resistance.
Note the levels of interest below:
- Pivot support is noted at 82.5885, 82.3306, 82.1977
- Pivot resistance is noted at 82.9794, 83.1123, 83.3702
| Levels | Levels.1 |
|---|---|
| Previous Daily High | 82.8544 |
| Previous Daily Low | 82.4635 |
| Previous Weekly High | 83.2100 |
| Previous Weekly Low | 82.3485 |
| Previous Monthly High | 82.8334 |
| Previous Monthly Low | 81.6588 |
| Daily Fibonacci 38.2% | 82.7050 |
| Daily Fibonacci 61.8% | 82.6128 |
| Daily Pivot Point S1 | 82.5885 |
| Daily Pivot Point S2 | 82.3306 |
| Daily Pivot Point S3 | 82.1977 |
| Daily Pivot Point R1 | 82.9794 |
| Daily Pivot Point R2 | 83.1123 |
| Daily Pivot Point R3 | 83.3702 |
[/s2If]
Download Nehcap EAWe have two EAs that are operational on our LIVE accounts.
- EA-FIX: Check out the details here. Download EA-FIX . EA-FIX is a non-grid HFT scalper.
- EA-GROWTH: High quality low dd EA using trend grids. Download EA_GROWTHJoin Our Telegram Group
")


