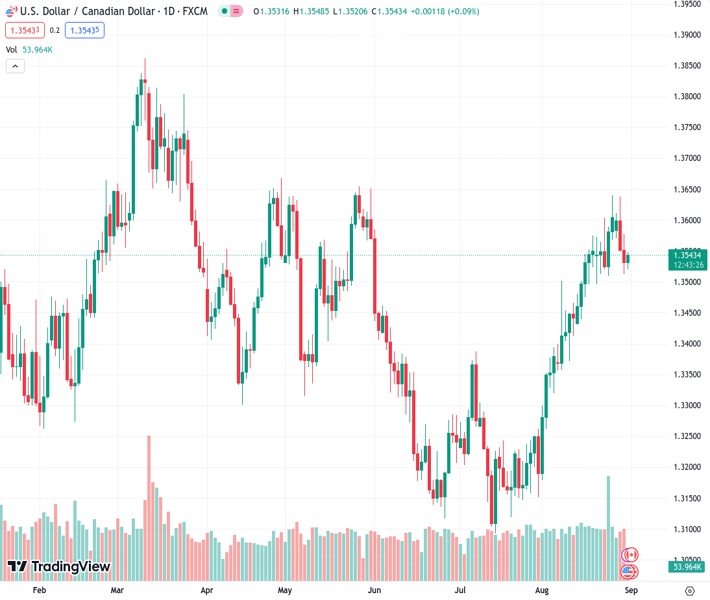
The USDCAD currency pair shows signs of improvement on Thursday, with its value of 1.35456 experiencing a small increase. This positive movement is influenced by a slight rise in the value of the USD.
…
This is a premium post.
[s2If !current_user_can(access_s2member_level4)]Please register for FREE REGISTER to read full post below containing analysis. In case of any error or you think you are not able to read the full post below, please email us at support#nehcap.com [lwa][/s2If] [s2If current_user_can(access_s2member_level1)]
- USD/CAD gains some positive traction on Thursday and draws support from a modest USD uptick.
The pair currently trades last at 1.35456.
The previous day high was 1.3577 while the previous day low was 1.3513. The daily 38.2% Fib levels comes at 1.3537, expected to provide support. Similarly, the daily 61.8% fib level is at 1.3553, expected to provide resistance.
The USD/CAD pair attracts some buying on Thursday and for now, seems to have stalled a two-day-old corrective slide from the vicinity of a nearly three-month peak, around the 1.3635-1.3640 area touched last week. Spot prices stick to modest intraday gains through the early part of the European session, albeit lack follow-through and remain below mid-1.3500s.
The US Dollar (USD) stages a goodish bounce from the very important 200-day Simple Moving Average (SMA) and snaps a three-day losing streak to a two-week low, which, in turn, acts as a tailwind for the USD/CAD pair. That said, Wednesday’s weaker US macro data reaffirms expectations that the Federal Reserve (Fed) is nearing the end of its rate-hiking cycle and keeping a lid on the Greenback.
Furthermore, Crude Oil prices stand tall near the highest level in more than two weeks and undermine the commodity-linked Loonie. This further contributes to capping the upside for the USD/CAD pair. Traders also refrain from placing aggressive bets and prefer to wait for the release of the US Core PCE Price Index – the Fed’s preferred inflation gauge – later during the early North American session.
From a technical perspective, the recent sustained breakout through the 200-day SMA and a subsequent move beyond the 1.3500 psychological mark was seen as a fresh trigger for the USD/CAD bulls. Moreover, the Relative Strength Index (RSI) on the daily chart has eased from the overbought territory and supports prospects for the emergence of some dip-buying, which should help limit the downside.
Some follow-through selling below the 1.3500 mark, however, might expose the 1.3460-1.3455 region (200-day SMA), which if broken decisively would make the USD/CAD pair vulnerable. Spot prices might then accelerate the downfall towards the next relevant support near the 1.3400 round figure en route to the 1.3370 region.
On the flip side, the overnight swing high, around the 1.3575 area, now seems to act as an immediate hurdle ahead of the 1.3600 round figure. Any further more up is more likely to confront resistance near the monthly peak, around the 1.3635-1.3640 area, above which the USD/CAD pair could aim to reclaim the 1.3700 mark and climb further towards the 1.3740-1.3745 resistance zone. The momentum could get extended further towards the 1.3800 round figure en route to the YTD peak, around the 1.3860 area touched in March.
Technical Levels: Supports and Resistances
USDCAD currently trading at 1.3539 at the time of writing. Pair opened at 1.3532 and is trading with a change of 0.05 % .
| Overview | Overview.1 | |
|---|---|---|
| 0 | Today last price | 1.3539 |
| 1 | Today Daily Change | 0.0007 |
| 2 | Today Daily Change % | 0.0500 |
| 3 | Today daily open | 1.3532 |
The pair remains strongly bullish on the daily timeframe. It trades above its 20 SMA @ 1.3495, 50 SMA 1.3331, 100 SMA @ 1.3392 and 200 SMA @ 1.3462.
| Trends | Trends.1 | |
|---|---|---|
| 0 | Daily SMA20 | 1.3495 |
| 1 | Daily SMA50 | 1.3331 |
| 2 | Daily SMA100 | 1.3392 |
| 3 | Daily SMA200 | 1.3462 |
The previous day high was 1.3577 while the previous day low was 1.3513. The daily 38.2% Fib levels comes at 1.3537, expected to provide support. Similarly, the daily 61.8% fib level is at 1.3553, expected to provide resistance.
Note the levels of interest below:
- Pivot support is noted at 1.3505, 1.3477, 1.3441
- Pivot resistance is noted at 1.3569, 1.3605, 1.3632
| Levels | Levels.1 |
|---|---|
| Previous Daily High | 1.3577 |
| Previous Daily Low | 1.3513 |
| Previous Weekly High | 1.3640 |
| Previous Weekly Low | 1.3496 |
| Previous Monthly High | 1.3387 |
| Previous Monthly Low | 1.3093 |
| Daily Fibonacci 38.2% | 1.3537 |
| Daily Fibonacci 61.8% | 1.3553 |
| Daily Pivot Point S1 | 1.3505 |
| Daily Pivot Point S2 | 1.3477 |
| Daily Pivot Point S3 | 1.3441 |
| Daily Pivot Point R1 | 1.3569 |
| Daily Pivot Point R2 | 1.3605 |
| Daily Pivot Point R3 | 1.3632 |
[/s2If]
Download Nehcap EAWe have two EAs that are operational on our LIVE accounts.
- EA-FIX: Check out the details here. Download EA-FIX . EA-FIX is a non-grid HFT scalper.
- EA-GROWTH: High quality low dd EA using trend grids. Download EA_GROWTHJoin Our Telegram Group
")


