The US dollar to Canadian dollar exchange rate of 1.35302 is still under pressure and hovering around the level of 1.3530 due to the weakness of the US dollar.
…
This is a premium post.
[s2If !current_user_can(access_s2member_level4)]Please register for FREE REGISTER to read full post below containing analysis. In case of any error or you think you are not able to read the full post below, please email us at support#nehcap.com [lwa][/s2If] [s2If current_user_can(access_s2member_level1)]
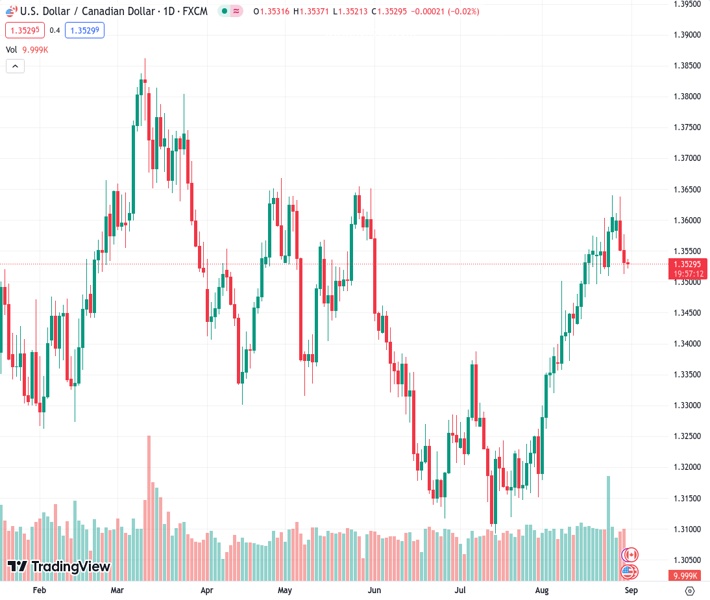
- USD/CAD remains on the defensive around 1.3530 amid the USD weakness.
The pair currently trades last at 1.35302.
The previous day high was 1.3577 while the previous day low was 1.3513. The daily 38.2% Fib levels comes at 1.3537, expected to provide resistance. Similarly, the daily 61.8% fib level is at 1.3553, expected to provide resistance.
The USD/CAD pair consolidates its recent losses below the mid-1.3500s during the early Asian session on Thursday. The softer US economic data and a decline in Treasury yields continue to exert downward pressure on the Greenback. The major pair currently trades near 1.3530, unchanged on the day.
On Wednesday, Automatic Data Processing, Inc. revealed that the US ADP Employment Change declined to 177K in August from 371K in July and missed the market expectation of 195K. Meanwhile, the first estimate of Personal Consumption Expenditures (PCE) Prices for the second quarter fell to 2.5% from 2.6% previously. The second measurement of Gross Domestic Product (GDP) Annualised Q2 decreased to 2.1% from the first 2.4% estimate.
Markets anticipate that the Federal Reserve (Fed) will end its tightened policy sooner than expected. According to the CME FedWatch tool, markets are now pricing near 40% a rate hike in November and will cut the rate in June 2024. This, in turn, exerts some selling pressure on the Greenback across its rivals and acts as a headwind for the USD/CAD pair.
On the Loonie front, no relevant data was released from the Canadian docket earlier this week. Nevertheless, a rebound in oil prices limits the downside of the Canadian Dollar as Canada is the largest exporter of crude to the US. Last week, the monthly Canadian Retail Sales for June expanded by 0.1% from the previous month, better than the expectation of 0%. Retail Sales ex-auto declined 0.8%, worse than the market consensus of an increase of 0.3%. Market players will take cues from the Q2 Gross Domestic Product (GDP) data due later on Friday. The better-than-expected Canadian data might prompt the possibility of more tightening policy from the Bank of Canada (BoC).
Looking ahead, the Canadian Current Account Q2 and Gross Domestic Product (GDP) will be due on Thursday and Friday, respectively. On the US docket, the US Core Personal Consumption Expenditure Price Index (PCE), the weekly Jobless Claims, and the Chicago PMI will be released later in the day. The US Nonfarm Payrolls (NFP) will be the highlight of the week. Investors will find trading opportunities for the USD/CAD pair.
Technical Levels: Supports and Resistances
USDCAD currently trading at 1.3531 at the time of writing. Pair opened at 1.3532 and is trading with a change of -0.01 % .
| Overview | Overview.1 | |
|---|---|---|
| 0 | Today last price | 1.3531 |
| 1 | Today Daily Change | -0.0001 |
| 2 | Today Daily Change % | -0.0100 |
| 3 | Today daily open | 1.3532 |
The pair remains strongly bullish on the daily timeframe. It trades above its 20 SMA @ 1.3495, 50 SMA 1.3331, 100 SMA @ 1.3392 and 200 SMA @ 1.3462.
| Trends | Trends.1 | |
|---|---|---|
| 0 | Daily SMA20 | 1.3495 |
| 1 | Daily SMA50 | 1.3331 |
| 2 | Daily SMA100 | 1.3392 |
| 3 | Daily SMA200 | 1.3462 |
The previous day high was 1.3577 while the previous day low was 1.3513. The daily 38.2% Fib levels comes at 1.3537, expected to provide resistance. Similarly, the daily 61.8% fib level is at 1.3553, expected to provide resistance.
Note the levels of interest below:
- Pivot support is noted at 1.3505, 1.3477, 1.3441
- Pivot resistance is noted at 1.3569, 1.3605, 1.3632
| Levels | Levels.1 |
|---|---|
| Previous Daily High | 1.3577 |
| Previous Daily Low | 1.3513 |
| Previous Weekly High | 1.3640 |
| Previous Weekly Low | 1.3496 |
| Previous Monthly High | 1.3387 |
| Previous Monthly Low | 1.3093 |
| Daily Fibonacci 38.2% | 1.3537 |
| Daily Fibonacci 61.8% | 1.3553 |
| Daily Pivot Point S1 | 1.3505 |
| Daily Pivot Point S2 | 1.3477 |
| Daily Pivot Point S3 | 1.3441 |
| Daily Pivot Point R1 | 1.3569 |
| Daily Pivot Point R2 | 1.3605 |
| Daily Pivot Point R3 | 1.3632 |
[/s2If]
Download Nehcap EAWe have two EAs that are operational on our LIVE accounts.
- EA-FIX: Check out the details here. Download EA-FIX . EA-FIX is a non-grid HFT scalper.
- EA-GROWTH: High quality low dd EA using trend grids. Download EA_GROWTHJoin Our Telegram Group
")


