The price of silver, represented by the XAGUSD symbol, has decreased for two consecutive days and has moved even farther away from its highest point in over a month.
…
This is a premium post.
[s2If !current_user_can(access_s2member_level4)]Please register for FREE REGISTER to read full post below containing analysis. In case of any error or you think you are not able to read the full post below, please email us at support#nehcap.com [lwa][/s2If] [s2If current_user_can(access_s2member_level1)]
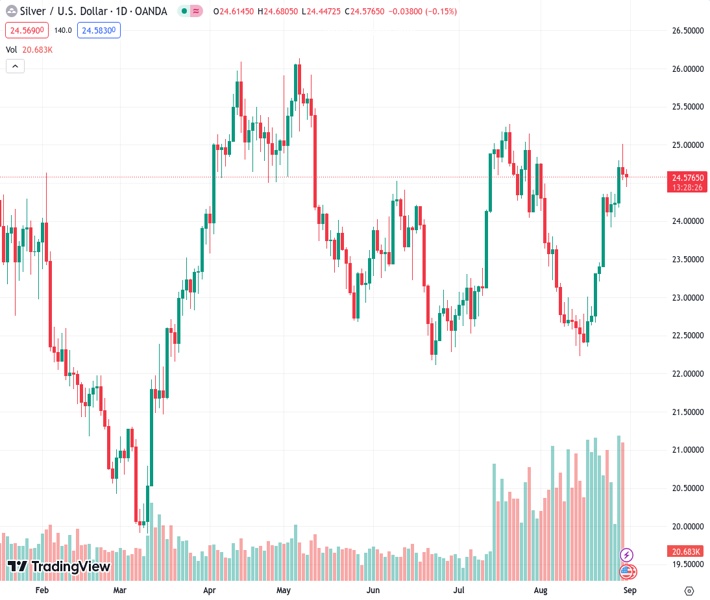
- Silver drifts lower for the second straight day and retreats further from over a one-month peak.
The pair currently trades last at 24.548.
The previous day high was 25.02 while the previous day low was 24.53. The daily 38.2% Fib levels comes at 24.72, expected to provide resistance. Similarly, the daily 61.8% fib level is at 24.83, expected to provide resistance.
Silver extends the previous day’s rejection slide from the $25.00 psychological mark, or over a one-month high and remains under some selling pressure for the second successive day on Thursday. The white metal, however, manages to recover a bit from the daily low and trade just above mid-$24.00s during the early part of the European session, down less than 0.30% for the day.
From a technical perspective, this week’s breakout through the $24.35-$24.40 barrier was seen as a fresh trigger for bulls. Adding to this, oscillators on the daily chart are holding comfortably in the positive territory and still far from being in the overbought zone. This, in turn, supports prospects for the emergence of some dip-buying and suggests that the path of least resistance for the XAG/USD is to the upside. Hence, any subsequent slide below the said resistance-turned-support is more likely to find decent support and remain limited near the $24.00 round-figure mark.
The latter nears the upward-sloping 200-hour Simple Moving Average (SMA) and should act as a strong base for the XAG/USD. Sustained weakness below, however, might prompt some technical selling and drag the white metal further towards the $23.55 region. This is closely followed by support near the $23.40 area, representing the 200-day SMA, which if broken decisively might shift the near-term bias in favour of bearish traders and pave the way for a fall towards retesting sub-$23.00 levels en route to the $22.20 area, or the lowest level since June 23 touched earlier this month.
On the flip side, the $24.70 region could act as an immediate resistance ahead of the $25.00 mark. Some follow-through buying has the potential to lift the XAG/USD further beyond the $25.25 intermediate hurdle, representing the July monthly swing high, towards the $26.00 round figure. This is closely followed by the YTD peak, around the $26.15 region touched in May, which if cleared should pave the way for an extension of the uptrend witnessed over the past two weeks or so.
Technical Levels: Supports and Resistances
XAGUSD currently trading at 24.56 at the time of writing. Pair opened at 24.61 and is trading with a change of -0.2 % .
| Overview | Overview.1 | |
|---|---|---|
| 0 | Today last price | 24.56 |
| 1 | Today Daily Change | -0.05 |
| 2 | Today Daily Change % | -0.20 |
| 3 | Today daily open | 24.61 |
The pair remains strongly bullish on the daily timeframe. It trades above its 20 SMA @ 23.36, 50 SMA 23.6, 100 SMA @ 23.96 and 200 SMA @ 23.4.
| Trends | Trends.1 | |
|---|---|---|
| 0 | Daily SMA20 | 23.36 |
| 1 | Daily SMA50 | 23.60 |
| 2 | Daily SMA100 | 23.96 |
| 3 | Daily SMA200 | 23.40 |
The previous day high was 25.02 while the previous day low was 24.53. The daily 38.2% Fib levels comes at 24.72, expected to provide resistance. Similarly, the daily 61.8% fib level is at 24.83, expected to provide resistance.
Note the levels of interest below:
- Pivot support is noted at 24.42, 24.24, 23.94
- Pivot resistance is noted at 24.91, 25.2, 25.39
| Levels | Levels.1 |
|---|---|
| Previous Daily High | 25.02 |
| Previous Daily Low | 24.53 |
| Previous Weekly High | 24.38 |
| Previous Weekly Low | 22.67 |
| Previous Monthly High | 25.27 |
| Previous Monthly Low | 22.52 |
| Daily Fibonacci 38.2% | 24.72 |
| Daily Fibonacci 61.8% | 24.83 |
| Daily Pivot Point S1 | 24.42 |
| Daily Pivot Point S2 | 24.24 |
| Daily Pivot Point S3 | 23.94 |
| Daily Pivot Point R1 | 24.91 |
| Daily Pivot Point R2 | 25.20 |
| Daily Pivot Point R3 | 25.39 |
[/s2If]
Download Nehcap EAWe have two EAs that are operational on our LIVE accounts.
- EA-FIX: Check out the details here. Download EA-FIX . EA-FIX is a non-grid HFT scalper.
- EA-GROWTH: High quality low dd EA using trend grids. Download EA_GROWTHJoin Our Telegram Group
")


