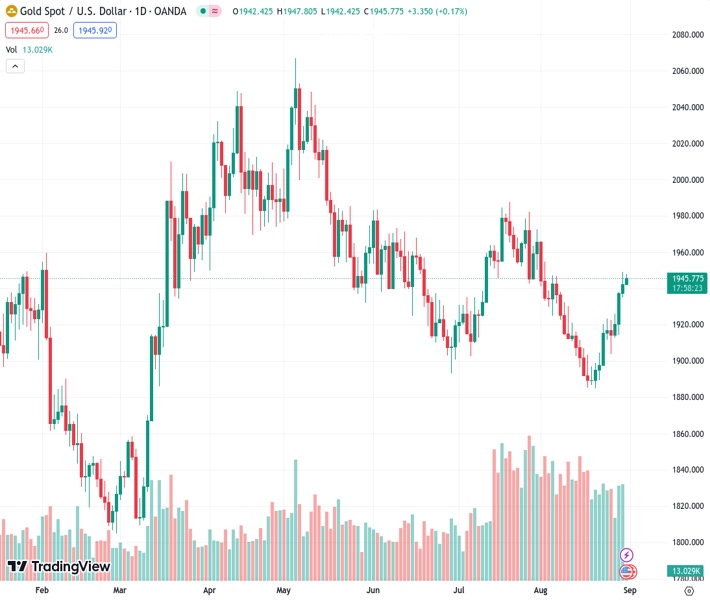
The price of gold (XAUUSD) at 1,945.97 moves higher for the fourth consecutive day and remains strong near its highest level in several weeks.
…
This is a premium post.
[s2If !current_user_can(access_s2member_level4)]Please register for FREE REGISTER to read full post below containing analysis. In case of any error or you think you are not able to read the full post below, please email us at support#nehcap.com [lwa][/s2If] [s2If current_user_can(access_s2member_level1)]
- Gold price gains positive traction for the fourth straight day and stands tall near a multi-week top.
The pair currently trades last at 1945.97.
The previous day high was 1949.11 while the previous day low was 1935.01. The daily 38.2% Fib levels comes at 1943.72, expected to provide support. Similarly, the daily 61.8% fib level is at 1940.4, expected to provide support.
Gold price attracts some buying for the fourth successive day on Thursday and climbs back above the $1,945 level during the Asian session, closer to a four-week high touched the previous day. The XAU/USD might now look to build on its recovery from the lowest level since March 13, around the $1,885 region touched last week.
The US Dollar (USD) languishes near a two-week low touched in the aftermath of the disappointing macro data from the United States (US) released on Wednesday and turns out to be a key factor acting as a tailwind for the Gold price. In fact, Automatic Data Processing (ADP) reported that the US private sector employers added 177K jobs in August, much lower than the previous month’s downwardly revised reading of 324K and missing expectations for a reading of 195K. Adding to this, the second estimate showed that the US economy expanded by a 2.1% annualized pace in the second quarter against the 2.4% growth reported originally.
Against the backdrop of a fall in the Conference Board’s Consumer Confidence Index from 114.0 to 106.1 in August, the data reaffirms market expectations that the Federal Reserve (Fed) will pause its rate-hiking cycle in September. This continues to exert some pressure on the US Treasury bond yields, which keeps the USD bulls on the defensive and benefits the non-yielding Gold price. Apart from this, worries about a deeper global economic downturn further seem to lend additional support to the safe-haven precious metal, though a positive risk tone might keep a lid on any further gains, at least for the time being.
Traders might also prefer to move to the sidelines ahead of the release of the US PCE Price Index – the Fed’s preferred inflation gauge – later during the early North American session. The markets are still pricing in the possibility of a 25 basis points (bps) lift-off by the US central bank in 2023. Hence, the data will influence expectations about the Fed’s rate-hike path, which, in turn, will drive the USD demand and provide a fresh impetus to the US Dollar-denominated Gold price. Barring any positive surprise from the US inflation data, the fundamental backdrop suggests that the path of least resistance for the XAU/USD is to the upside.
Technical Levels: Supports and Resistances
XAUUSD currently trading at 1946.66 at the time of writing. Pair opened at 1942.42 and is trading with a change of 0.22 % .
| Overview | Overview.1 | |
|---|---|---|
| 0 | Today last price | 1946.66 |
| 1 | Today Daily Change | 4.24 |
| 2 | Today Daily Change % | 0.22 |
| 3 | Today daily open | 1942.42 |
The pair is trading above its 20 Daily moving average @ 1914.97, above its 50 Daily moving average @ 1930.37 , below its 100 Daily moving average @ 1955.94 and above its 200 Daily moving average @ 1913.01
| Trends | Trends.1 | |
|---|---|---|
| 0 | Daily SMA20 | 1914.97 |
| 1 | Daily SMA50 | 1930.37 |
| 2 | Daily SMA100 | 1955.94 |
| 3 | Daily SMA200 | 1913.01 |
The previous day high was 1949.11 while the previous day low was 1935.01. The daily 38.2% Fib levels comes at 1943.72, expected to provide support. Similarly, the daily 61.8% fib level is at 1940.4, expected to provide support.
Note the levels of interest below:
- Pivot support is noted at 1935.25, 1928.08, 1921.15
- Pivot resistance is noted at 1949.35, 1956.28, 1963.45
| Levels | Levels.1 |
|---|---|
| Previous Daily High | 1949.11 |
| Previous Daily Low | 1935.01 |
| Previous Weekly High | 1923.43 |
| Previous Weekly Low | 1884.85 |
| Previous Monthly High | 1987.54 |
| Previous Monthly Low | 1902.77 |
| Daily Fibonacci 38.2% | 1943.72 |
| Daily Fibonacci 61.8% | 1940.40 |
| Daily Pivot Point S1 | 1935.25 |
| Daily Pivot Point S2 | 1928.08 |
| Daily Pivot Point S3 | 1921.15 |
| Daily Pivot Point R1 | 1949.35 |
| Daily Pivot Point R2 | 1956.28 |
| Daily Pivot Point R3 | 1963.45 |
[/s2If]
Download Nehcap EAWe have two EAs that are operational on our LIVE accounts.
- EA-FIX: Check out the details here. Download EA-FIX . EA-FIX is a non-grid HFT scalper.
- EA-GROWTH: High quality low dd EA using trend grids. Download EA_GROWTHJoin Our Telegram Group
")


