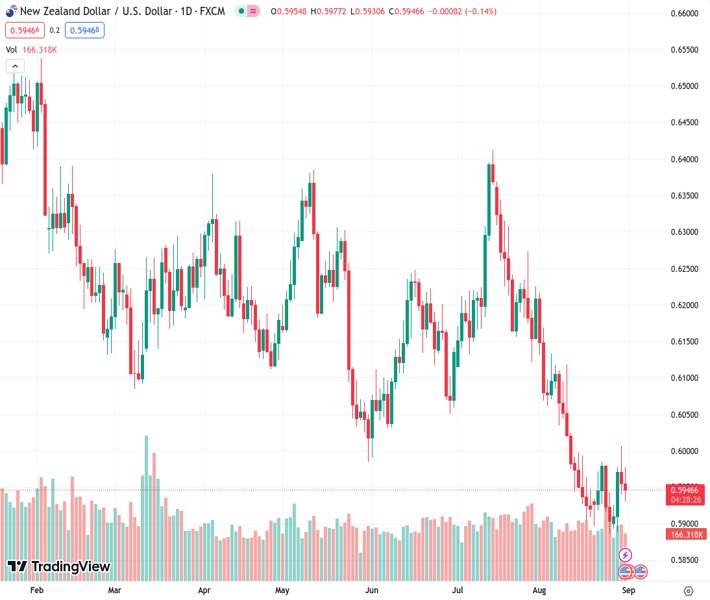
The NZDUSD pair is staying below the 20-day Simple Moving Average (SMA) of 0.5973 and is consolidating around the 0.5950 level. This marks the second day in a row that the pair has experienced losses.
…
This is a premium post.
[s2If !current_user_can(access_s2member_level4)]Please register for FREE REGISTER to read full post below containing analysis. In case of any error or you think you are not able to read the full post below, please email us at support#nehcap.com [lwa][/s2If] [s2If current_user_can(access_s2member_level1)]
- The NZD/USD consolidates below the 20-day SMA of 0.5973 towards the 0.5950 area, tallying a second consecutive day of losses.
The pair currently trades last at 0.59461.
The previous day high was 0.6007 while the previous day low was 0.5939. The daily 38.2% Fib levels comes at 0.5965, expected to provide resistance. Similarly, the daily 61.8% fib level is at 0.5981, expected to provide resistance.
On Thursday, the NZD/USD saw losses, driven by robust economic data, making the USD recover against most of its rivals. During the week, the US economy has been sending mixed, and the markets eagerly await Friday’s Nonfarm Payrolls report to continue placing their bets on the next Federal Reserve’s (Fed) decisions.
The Core Personal Consumption Expenditures (PCE), one of the Fed’s preferred gauges for inflation, rose to 3.3% YoY in July, matching the market’s expectations. In addition, Initial Jobless Claims for the week ending on August 25 came in at 228,000, lower than the 235,000 expected and the previous figures of 232,000. Other data showed that the Chicago PMI increased to 48.7, bearing both the expected and previous figures.
Reacting to the strong PCE and Claims figures, the USD, measured by the DXY index, rose to 103.70, seeing more than 0.50% gains, while the US Treasury yields recovered somewhat, but they are still in decline.
Regarding the Federal Reserve (Fed) expectations, the World Interest Rates Probabilities tool suggests that markets the odds of a 25 bps increase stand at 50%, down from 70% on Tuesday, for the November meeting. However, those bets will likely change after Friday’s Nonfarm Payrolls release, as a hot reading may push investors to bet on higher chances of a hike.
Upon analyzing the daily chart, a neutral to bearish trend becomes evident for NZD/USD, with the bears are seen gradually taking control. The Relative Strength Index (RSI) reveals a selling momentum with a downward slope below its middle point, while the Moving Average Convergence (MACD) lays out flat green bars. Plus, the pair is below the 20,100 and 200-day Simple Moving Averages (SMAs), indicating that the sellers dominate the broader perspective, and the buyers need to increase their efforts.
Support levels: 0.5940, 0.5930, 0.5900.
Resistance levels: 0.5973 (20-day SMA), 0.6000, 0.6030.
Technical Levels: Supports and Resistances
NZDUSD currently trading at 0.5952 at the time of writing. Pair opened at 0.5956 and is trading with a change of -0.07 % .
| Overview | Overview.1 | |
|---|---|---|
| 0 | Today last price | 0.5952 |
| 1 | Today Daily Change | -0.0004 |
| 2 | Today Daily Change % | -0.0700 |
| 3 | Today daily open | 0.5956 |
The pair remains strongly bearish on the daily time frame. It trades below the 20 SMA @ 0.5981, 50 SMA 0.611, 100 SMA @ 0.6144 and 200 SMA @ 0.6224.
| Trends | Trends.1 | |
|---|---|---|
| 0 | Daily SMA20 | 0.5981 |
| 1 | Daily SMA50 | 0.6110 |
| 2 | Daily SMA100 | 0.6144 |
| 3 | Daily SMA200 | 0.6224 |
The previous day high was 0.6007 while the previous day low was 0.5939. The daily 38.2% Fib levels comes at 0.5965, expected to provide resistance. Similarly, the daily 61.8% fib level is at 0.5981, expected to provide resistance.
Note the levels of interest below:
- Pivot support is noted at 0.5928, 0.5899, 0.586
- Pivot resistance is noted at 0.5996, 0.6035, 0.6064
| Levels | Levels.1 |
|---|---|
| Previous Daily High | 0.6007 |
| Previous Daily Low | 0.5939 |
| Previous Weekly High | 0.5987 |
| Previous Weekly Low | 0.5885 |
| Previous Monthly High | 0.6413 |
| Previous Monthly Low | 0.6120 |
| Daily Fibonacci 38.2% | 0.5965 |
| Daily Fibonacci 61.8% | 0.5981 |
| Daily Pivot Point S1 | 0.5928 |
| Daily Pivot Point S2 | 0.5899 |
| Daily Pivot Point S3 | 0.5860 |
| Daily Pivot Point R1 | 0.5996 |
| Daily Pivot Point R2 | 0.6035 |
| Daily Pivot Point R3 | 0.6064 |
[/s2If]
Download Nehcap EAWe have two EAs that are operational on our LIVE accounts.
- EA-FIX: Check out the details here. Download EA-FIX . EA-FIX is a non-grid HFT scalper.
- EA-GROWTH: High quality low dd EA using trend grids. Download EA_GROWTHJoin Our Telegram Group
")


