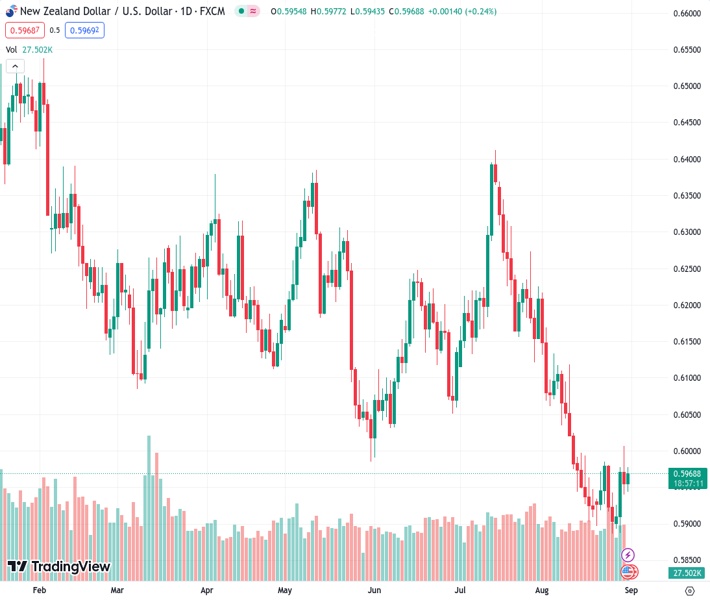
The New Zealand Dollar to US Dollar exchange rate, currently at 0.59675, experiences upward movement on Thursday and is helped by a decline in the strength of the US Dollar.
…
This is a premium post.
[s2If !current_user_can(access_s2member_level4)]Please register for FREE REGISTER to read full post below containing analysis. In case of any error or you think you are not able to read the full post below, please email us at support#nehcap.com [lwa][/s2If] [s2If current_user_can(access_s2member_level1)]
- NZD/USD regains positive traction on Thursday and is supported by a weaker USD.
The pair currently trades last at 0.59675.
The previous day high was 0.6007 while the previous day low was 0.5939. The daily 38.2% Fib levels comes at 0.5965, expected to provide support. Similarly, the daily 61.8% fib level is at 0.5981, expected to provide resistance.
The NZD/USD pair attracts some dip-buyers near the 0.5945-0.5940 area during the Asian session on Thursday and for now, seems to have stalled the overnight pullback from the 0.6000 psychological mark, or a nearly three-week high. Spot prices touch a fresh high, around the 0.5975 region in the last hour, though lack follow-through and react little to the mixed Chinese macro data.
The official PMI showed that business activity in China’s manufacturing sector registered a slight improvement in August, though remained in contraction territory for the fifth successive month in August. Moreover, growth in the Non-Manufacturing sector eased more than anticipated during the reported month. The rather unimpressive figures do little to ease concerns about the worsening economic conditions in China or provide any impetus to antipodean currencies, including the New Zealand Dollar (NZD).
That said, a weaker tone surrounding the US Dollar (USD) continues to act as a tailwind for the NZD/USD pair, at least for the time being. It is worth recalling that the USD Index (DXY), which tracks the Greenback against a basket of currencies, fell to a nearly two-week low on Wednesday following the disappointing release of US data. The ADP reported that Private sector employment in the US rose by 177K in August against the 195K anticipated and the previous month’s downwardly revised reading of 324 K.
Adding to this, the second estimate of the US Q2 GDP print showed that the world’s largest economy grew by a 2.1% annualized pace as compared to the 2.4% expansion reported originally. This comes on the back of a fall in the Conference Board’s Consumer Confidence Index to 106.1 in August from 114.0 in July and lift expectations that the Federal Reserve (Fed) will pause its rate-hiking cycle in September. The repricing of the Fed’s rate-hike path leads to the overnight downfall in the US Treasury bond yields, which keeps the USD bulls on the defensive for the fourth straight day and lends some support to the NZD/USD pair.
The upside potential, however, seems limited as traders might refrain from placing aggressive best ahead of the release of the US Core PCE Price Index – the Fed’s preferred inflation gauge. This will be accompanied by the usual Weekly Initial Jobless Claims data, which might influence the USD price dynamic and produce short-term trading opportunities around the NZD/USD pair. The focus will then shift to the US monthly jobs report – NFP – on Friday.
Technical Levels: Supports and Resistances
NZDUSD currently trading at 0.5962 at the time of writing. Pair opened at 0.5956 and is trading with a change of 0.1 % .
| Overview | Overview.1 | |
|---|---|---|
| 0 | Today last price | 0.5962 |
| 1 | Today Daily Change | 0.0006 |
| 2 | Today Daily Change % | 0.1000 |
| 3 | Today daily open | 0.5956 |
The pair remains strongly bearish on the daily time frame. It trades below the 20 SMA @ 0.5981, 50 SMA 0.611, 100 SMA @ 0.6144 and 200 SMA @ 0.6224.
| Trends | Trends.1 | |
|---|---|---|
| 0 | Daily SMA20 | 0.5981 |
| 1 | Daily SMA50 | 0.6110 |
| 2 | Daily SMA100 | 0.6144 |
| 3 | Daily SMA200 | 0.6224 |
The previous day high was 0.6007 while the previous day low was 0.5939. The daily 38.2% Fib levels comes at 0.5965, expected to provide support. Similarly, the daily 61.8% fib level is at 0.5981, expected to provide resistance.
Note the levels of interest below:
- Pivot support is noted at 0.5928, 0.5899, 0.586
- Pivot resistance is noted at 0.5996, 0.6035, 0.6064
| Levels | Levels.1 |
|---|---|
| Previous Daily High | 0.6007 |
| Previous Daily Low | 0.5939 |
| Previous Weekly High | 0.5987 |
| Previous Weekly Low | 0.5885 |
| Previous Monthly High | 0.6413 |
| Previous Monthly Low | 0.6120 |
| Daily Fibonacci 38.2% | 0.5965 |
| Daily Fibonacci 61.8% | 0.5981 |
| Daily Pivot Point S1 | 0.5928 |
| Daily Pivot Point S2 | 0.5899 |
| Daily Pivot Point S3 | 0.5860 |
| Daily Pivot Point R1 | 0.5996 |
| Daily Pivot Point R2 | 0.6035 |
| Daily Pivot Point R3 | 0.6064 |
[/s2If]
Download Nehcap EAWe have two EAs that are operational on our LIVE accounts.
- EA-FIX: Check out the details here. Download EA-FIX . EA-FIX is a non-grid HFT scalper.
- EA-GROWTH: High quality low dd EA using trend grids. Download EA_GROWTHJoin Our Telegram Group
")


