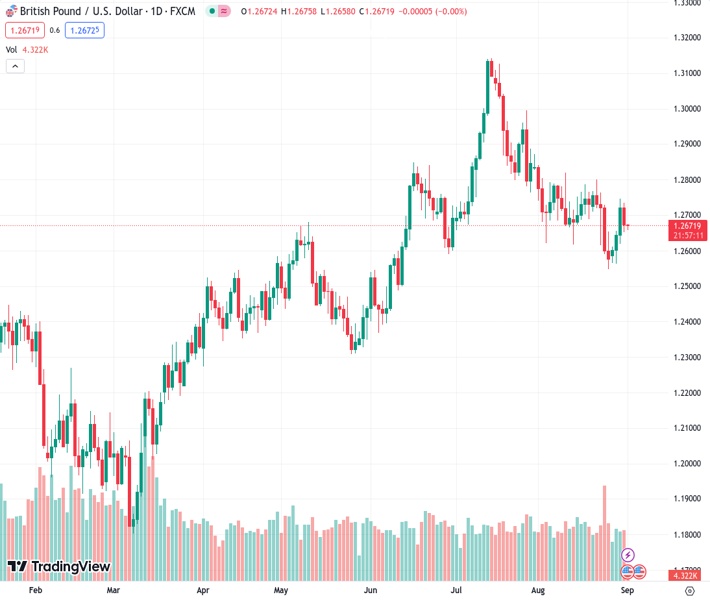
The GBPUSD currency pair, currently trading at 1.26700, has seen an increase in buying activity to recover from its first daily loss in four days. This recovery is likely in preparation for a weekly gain. The viewpoint from @nehcap suggests that a temporary decline in price is anticipated.
…
This is a premium post.
[s2If !current_user_can(access_s2member_level4)]Please register for FREE REGISTER to read full post below containing analysis. In case of any error or you think you are not able to read the full post below, please email us at support#nehcap.com [lwa][/s2If] [s2If current_user_can(access_s2member_level1)]
- GBP/USD picks up bids to pare the first daily loss in four, bracing for the weekly gain.
The pair currently trades last at 1.26700.
The previous day high was 1.2746 while the previous day low was 1.2619. The daily 38.2% Fib levels comes at 1.2698, expected to provide resistance. Similarly, the daily 61.8% fib level is at 1.2668, expected to provide support.
GBP/USD portrays the pre-NFP consolidation while bouncing off 50-SMA amid the early hours of Friday’s trading, following the first daily loss in four. That said, the Cable pair picks up bids to 1.2675 by the press time while bracing for the weekly gains.
Despite the latest rebound, the GBP/USD pair remains on the seller’s radar due to the quote’s multiple failures to cross a five-week-long descending resistance line and sustained trading below the 200-SMA. Adding strength to the downside bias is the looming bear cross on the MACD.
With this, the Pound Sterling is likely to portray another attempt to break the 50-SMA support of 1.2660.
Following that, the GBP/USD bears may aim for a slightly descending support line stretched from early August and the previous monthly low, respectively near 1.2610 and 1.2550.
Meanwhile, a downward-sloping resistance line from July 27, near 1.2720, restricts the immediate upside of the Cable pair ahead of the 200-SMA surrounding 1.2760.
In a case where the Pound Sterling remains firmer past 1.2760, the buyers will aim for the previous monthly high of around 1.2830.
Apart from the technical details, the final readings of the UK S&P Global Manufacturing PMI, the US employment report and the ISM Manufacturing PMI for August will also be important to aptly forecast the GBP/USD moves. Also, a speech from the Bank of England (BoE) policymaker Huw Pill will offer additional directions to the pair traders.
Trend: Pullback expected
Technical Levels: Supports and Resistances
GBPUSD currently trading at 1.2674 at the time of writing. Pair opened at 1.2721 and is trading with a change of -0.37% % .
| Overview | Overview.1 | |
|---|---|---|
| 0 | Today last price | 1.2674 |
| 1 | Today Daily Change | -0.0047 |
| 2 | Today Daily Change % | -0.37% |
| 3 | Today daily open | 1.2721 |
The pair is trading below its 20 Daily moving average @ 1.2702, below its 50 Daily moving average @ 1.2781 , above its 100 Daily moving average @ 1.2647 and above its 200 Daily moving average @ 1.2411
| Trends | Trends.1 | |
|---|---|---|
| 0 | Daily SMA20 | 1.2702 |
| 1 | Daily SMA50 | 1.2781 |
| 2 | Daily SMA100 | 1.2647 |
| 3 | Daily SMA200 | 1.2411 |
The previous day high was 1.2746 while the previous day low was 1.2619. The daily 38.2% Fib levels comes at 1.2698, expected to provide resistance. Similarly, the daily 61.8% fib level is at 1.2668, expected to provide support.
Note the levels of interest below:
- Pivot support is noted at 1.2645, 1.2568, 1.2517
- Pivot resistance is noted at 1.2772, 1.2823, 1.29
| Levels | Levels.1 |
|---|---|
| Previous Daily High | 1.2746 |
| Previous Daily Low | 1.2619 |
| Previous Weekly High | 1.2800 |
| Previous Weekly Low | 1.2548 |
| Previous Monthly High | 1.3142 |
| Previous Monthly Low | 1.2659 |
| Daily Fibonacci 38.2% | 1.2698 |
| Daily Fibonacci 61.8% | 1.2668 |
| Daily Pivot Point S1 | 1.2645 |
| Daily Pivot Point S2 | 1.2568 |
| Daily Pivot Point S3 | 1.2517 |
| Daily Pivot Point R1 | 1.2772 |
| Daily Pivot Point R2 | 1.2823 |
| Daily Pivot Point R3 | 1.2900 |
[/s2If]
Download Nehcap EAWe have two EAs that are operational on our LIVE accounts.
- EA-FIX: Check out the details here. Download EA-FIX . EA-FIX is a non-grid HFT scalper.
- EA-GROWTH: High quality low dd EA using trend grids. Download EA_GROWTHJoin Our Telegram Group
")


