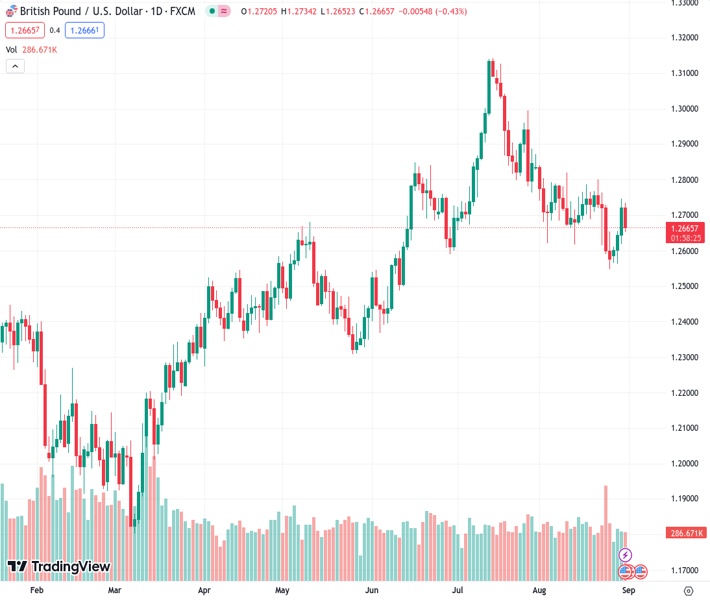
The GBP/USD pair dropped to the 1.2670 level, which is below the 20-day simple moving average.
…
This is a premium post.
[s2If !current_user_can(access_s2member_level4)]Please register for FREE REGISTER to read full post below containing analysis. In case of any error or you think you are not able to read the full post below, please email us at support#nehcap.com [lwa][/s2If] [s2If current_user_can(access_s2member_level1)]
- GBP/USD retreated towards the 1.2670 area, below the 20-day SMA.
The pair currently trades last at 1.26638.
The previous day high was 1.2746 while the previous day low was 1.2619. The daily 38.2% Fib levels comes at 1.2698, expected to provide resistance. Similarly, the daily 61.8% fib level is at 1.2668, expected to provide resistance.
On Thursday, the GBP/USD lost ground as the USD traded strongly against most of its rivals after the release of July’s Core Personal Consumption Expenditures (PCE) figures. The GBP’s losses are limited by tightening expectations on the Bank of England remaining high.
The Core PCE from July came in at 3.3%, up from its previous 3% and matched the consensus. In addition, the US reported that the Jobless Claims for the week ending in August 25 decelerated to 228,000, vs. the 235,000 expected and the previous 232,000 and hinted at some resilience of the labour market after the US reported soft employment figures on Tuesday.
All eyes are now on the Nonfarm Payrolls (NFP) report from August from the US to be reported on Friday, which will likely cause market volatility as that report is the ultimate gauge of the US labour market’s health. As the Federal Reserve (Fed) expects a cooling labour market, its outcome will help investors place bets on the next decisions.
On the GBP’s side, no relevant data was released, but its losses are limited by the tightening expectations of the Bank of England (BoE), and markets still bet on a terminal rate between 5.75%-6% for this cycle.
Based on the daily chart, GBP/USD maintains a neutral technical perspective as indicators send mixed signals. The Relative Strength Index (RSI) displays a negative slope in the bullish territory, hinting at a potential shift in momentum, while the Moving Average Convergence (MACD) displays shorter red bars. Moreover, the pair is below the 20-day Simple Moving Average (SMA) but above the 100 and 200-day SMAs, indicating a favourable position for the bulls in the bigger picture.
Support levels: 1.2645 (100-day SMA), 1.2600, 1.2550.
Resistance levels: 1.2700 (20-day SMA), 1.2730, 1.2750.
Technical Levels: Supports and Resistances
GBPUSD currently trading at 1.2666 at the time of writing. Pair opened at 1.2721 and is trading with a change of -0.43 % .
| Overview | Overview.1 | |
|---|---|---|
| 0 | Today last price | 1.2666 |
| 1 | Today Daily Change | -0.0055 |
| 2 | Today Daily Change % | -0.4300 |
| 3 | Today daily open | 1.2721 |
The pair is trading below its 20 Daily moving average @ 1.2702, below its 50 Daily moving average @ 1.2781 , above its 100 Daily moving average @ 1.2647 and above its 200 Daily moving average @ 1.2411
| Trends | Trends.1 | |
|---|---|---|
| 0 | Daily SMA20 | 1.2702 |
| 1 | Daily SMA50 | 1.2781 |
| 2 | Daily SMA100 | 1.2647 |
| 3 | Daily SMA200 | 1.2411 |
The previous day high was 1.2746 while the previous day low was 1.2619. The daily 38.2% Fib levels comes at 1.2698, expected to provide resistance. Similarly, the daily 61.8% fib level is at 1.2668, expected to provide resistance.
Note the levels of interest below:
- Pivot support is noted at 1.2645, 1.2568, 1.2517
- Pivot resistance is noted at 1.2772, 1.2823, 1.29
| Levels | Levels.1 |
|---|---|
| Previous Daily High | 1.2746 |
| Previous Daily Low | 1.2619 |
| Previous Weekly High | 1.2800 |
| Previous Weekly Low | 1.2548 |
| Previous Monthly High | 1.3142 |
| Previous Monthly Low | 1.2659 |
| Daily Fibonacci 38.2% | 1.2698 |
| Daily Fibonacci 61.8% | 1.2668 |
| Daily Pivot Point S1 | 1.2645 |
| Daily Pivot Point S2 | 1.2568 |
| Daily Pivot Point S3 | 1.2517 |
| Daily Pivot Point R1 | 1.2772 |
| Daily Pivot Point R2 | 1.2823 |
| Daily Pivot Point R3 | 1.2900 |
[/s2If]
Download Nehcap EAWe have two EAs that are operational on our LIVE accounts.
- EA-FIX: Check out the details here. Download EA-FIX . EA-FIX is a non-grid HFT scalper.
- EA-GROWTH: High quality low dd EA using trend grids. Download EA_GROWTHJoin Our Telegram Group
")


