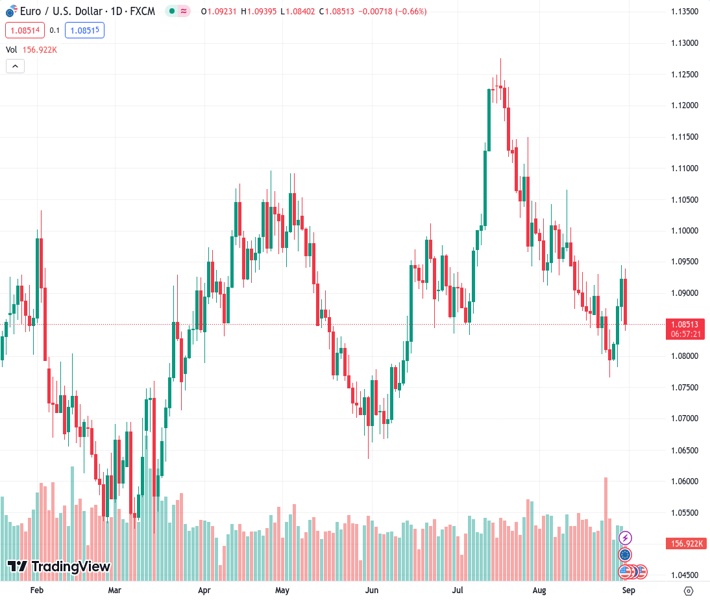
The EURUSD currency pair experiences a significant drop after gaining ground for three consecutive days.
…
This is a premium post.
[s2If !current_user_can(access_s2member_level4)]Please register for FREE REGISTER to read full post below containing analysis. In case of any error or you think you are not able to read the full post below, please email us at support#nehcap.com [lwa][/s2If] [s2If current_user_can(access_s2member_level1)]
- EUR/USD sharply reverses part of the recent three-day advance.
The pair currently trades last at 1.08471.
The previous day high was 1.0946 while the previous day low was 1.0855. The daily 38.2% Fib levels comes at 1.0911, expected to provide resistance. Similarly, the daily 61.8% fib level is at 1.089, expected to provide resistance.
EUR/USD faces strong headwinds and slips back to the 1.0860 zone on Thursday following tops near 1.0950 recorded in the previous session.
Despite the daily knee-jerk, the pair’s current momentum seems to be favouring the continuation of the march north for the time being. That said, there is a temporary hurdle at the 55-day SMA at 1.0968, which precedes the psychological 1.1000 mark and the August top of 1.1064 (August 10).
In case losses gather extra impulse, a pullback to the 200-day SMA, today at 1.0812, should not be ruled out.
In the meantime, the pair is likely to keep the bullish outlook unchanged while above the 200-day SMA.
Technical Levels: Supports and Resistances
EURUSD currently trading at 1.0861 at the time of writing. Pair opened at 1.0924 and is trading with a change of -0.58 % .
| Overview | Overview.1 | |
|---|---|---|
| 0 | Today last price | 1.0861 |
| 1 | Today Daily Change | 85.0000 |
| 2 | Today Daily Change % | -0.5800 |
| 3 | Today daily open | 1.0924 |
The pair is trading below its 20 Daily moving average @ 1.0904, below its 50 Daily moving average @ 1.0973 , below its 100 Daily moving average @ 1.0926 and above its 200 Daily moving average @ 1.0812
| Trends | Trends.1 | |
|---|---|---|
| 0 | Daily SMA20 | 1.0904 |
| 1 | Daily SMA50 | 1.0973 |
| 2 | Daily SMA100 | 1.0926 |
| 3 | Daily SMA200 | 1.0812 |
The previous day high was 1.0946 while the previous day low was 1.0855. The daily 38.2% Fib levels comes at 1.0911, expected to provide resistance. Similarly, the daily 61.8% fib level is at 1.089, expected to provide resistance.
Note the levels of interest below:
- Pivot support is noted at 1.0871, 1.0818, 1.078
- Pivot resistance is noted at 1.0961, 1.0998, 1.1051
| Levels | Levels.1 |
|---|---|
| Previous Daily High | 1.0946 |
| Previous Daily Low | 1.0855 |
| Previous Weekly High | 1.0930 |
| Previous Weekly Low | 1.0766 |
| Previous Monthly High | 1.1276 |
| Previous Monthly Low | 1.0834 |
| Daily Fibonacci 38.2% | 1.0911 |
| Daily Fibonacci 61.8% | 1.0890 |
| Daily Pivot Point S1 | 1.0871 |
| Daily Pivot Point S2 | 1.0818 |
| Daily Pivot Point S3 | 1.0780 |
| Daily Pivot Point R1 | 1.0961 |
| Daily Pivot Point R2 | 1.0998 |
| Daily Pivot Point R3 | 1.1051 |
[/s2If]
Download Nehcap EAWe have two EAs that are operational on our LIVE accounts.
- EA-FIX: Check out the details here. Download EA-FIX . EA-FIX is a non-grid HFT scalper.
- EA-GROWTH: High quality low dd EA using trend grids. Download EA_GROWTHJoin Our Telegram Group
")


