The EURSEK currency pair is facing difficulty in maintaining the rebound it made from a weekly low. According to the viewpoint of @nehcap, it is anticipated that there will be more downward movement in the future.
…
This is a premium post.
[s2If !current_user_can(access_s2member_level4)]Please register for FREE REGISTER to read full post below containing analysis. In case of any error or you think you are not able to read the full post below, please email us at support#nehcap.com [lwa][/s2If] [s2If current_user_can(access_s2member_level1)]
- EUR/SEK struggles to defend the previous day’s corrective bounce off weekly low.
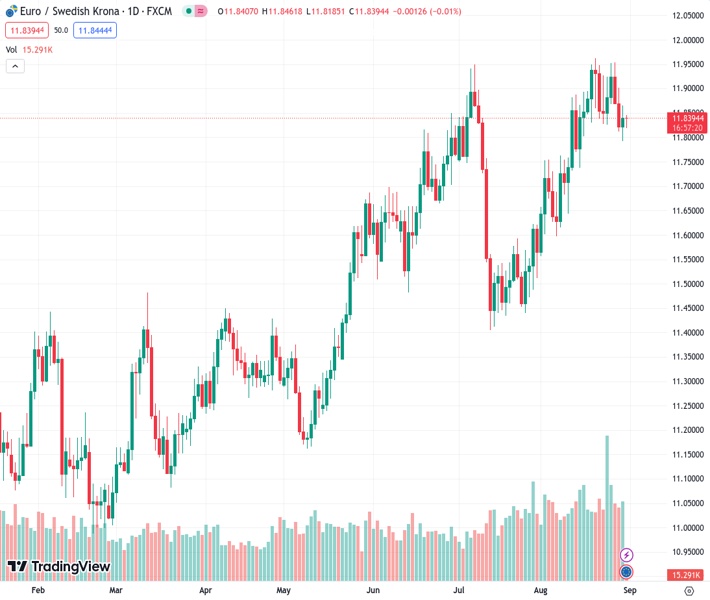
The pair currently trades last at 11.8396.
The previous day high was 11.866 while the previous day low was 11.7936. The daily 38.2% Fib levels comes at 11.8383, expected to provide support. Similarly, the daily 61.8% fib level is at 11.8212, expected to provide support.
EUR/SEK remains sidelined as buyers poke the 100-SMA hurdle heading into Thursday’s European session. In doing so, the Swedish Krona (SEK) pair edges higher around 11.85 as markets await the key Eurozone inflation data amid fears of witnessing a sooner policy pivot from the European Central Bank (ECB).
As a result, the first readings of the Eurozone Consumer Price Index (CPI) for August will join the ECB’s favorite inflation gauge, namely the Harmonized Index of Consumer Prices (HICP), to direct intraday moves of the EUR/SEK pair.
Given the recent challenges for the global central bankers, a surprise positive in the inflation numbers may allow the EUR/SEK to cross the immediate 100-SMA hurdle of 11.85.
Following that, a seven-week-old previous support line surrounding 11.93 and the double tops around 11.96 will test the Swedish Krona (SEK) sellers before directing them to the 12.00 threshold.
On the flip side, a clear break of the previous weekly low surrounding 11.77 will confirm the “double tops” bearish chart formation suggesting the theoretical slump toward 11.58. However, the 200-SMA level of around 11.71 may act as an intermediate halt during the theoretically expected fall.
Trend: Further downside expected
Technical Levels: Supports and Resistances
EURSEK currently trading at 11.8433 at the time of writing. Pair opened at 11.8436 and is trading with a change of -0.00% % .
| Overview | Overview.1 | |
|---|---|---|
| 0 | Today last price | 11.8433 |
| 1 | Today Daily Change | -0.0003 |
| 2 | Today Daily Change % | -0.00% |
| 3 | Today daily open | 11.8436 |
The pair remains strongly bullish on the daily timeframe. It trades above its 20 SMA @ 11.8153, 50 SMA 11.7241, 100 SMA @ 11.5878 and 200 SMA @ 11.3717.
| Trends | Trends.1 | |
|---|---|---|
| 0 | Daily SMA20 | 11.8153 |
| 1 | Daily SMA50 | 11.7241 |
| 2 | Daily SMA100 | 11.5878 |
| 3 | Daily SMA200 | 11.3717 |
The previous day high was 11.866 while the previous day low was 11.7936. The daily 38.2% Fib levels comes at 11.8383, expected to provide support. Similarly, the daily 61.8% fib level is at 11.8212, expected to provide support.
Note the levels of interest below:
- Pivot support is noted at 11.8028, 11.7619, 11.7303
- Pivot resistance is noted at 11.8752, 11.9068, 11.9477
| Levels | Levels.1 |
|---|---|
| Previous Daily High | 11.8660 |
| Previous Daily Low | 11.7936 |
| Previous Weekly High | 11.9646 |
| Previous Weekly Low | 11.7798 |
| Previous Monthly High | 11.9542 |
| Previous Monthly Low | 11.2825 |
| Daily Fibonacci 38.2% | 11.8383 |
| Daily Fibonacci 61.8% | 11.8212 |
| Daily Pivot Point S1 | 11.8028 |
| Daily Pivot Point S2 | 11.7619 |
| Daily Pivot Point S3 | 11.7303 |
| Daily Pivot Point R1 | 11.8752 |
| Daily Pivot Point R2 | 11.9068 |
| Daily Pivot Point R3 | 11.9477 |
[/s2If]
Download Nehcap EAWe have two EAs that are operational on our LIVE accounts.
- EA-FIX: Check out the details here. Download EA-FIX . EA-FIX is a non-grid HFT scalper.
- EA-GROWTH: High quality low dd EA using trend grids. Download EA_GROWTHJoin Our Telegram Group
")


