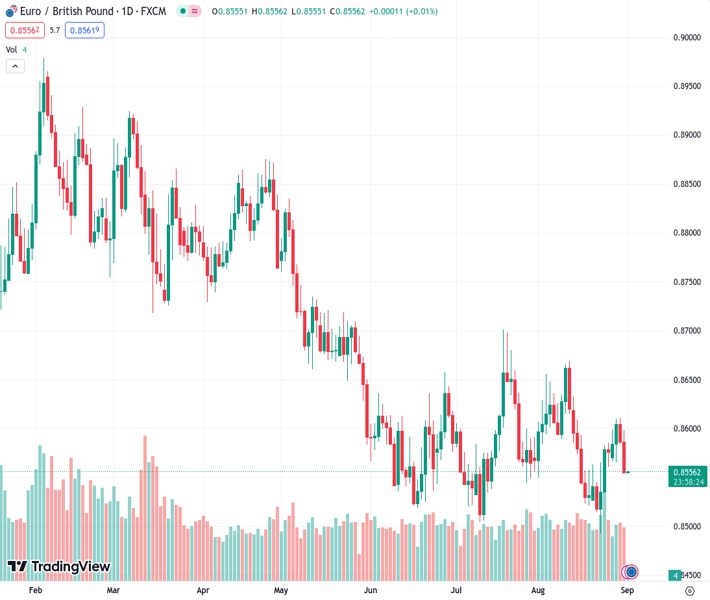
The bulls were unable to protect the 20-day SMA, resulting in a decline of the EURGBP cross rate to approximately 0.8555.
…
This is a premium post.
[s2If !current_user_can(access_s2member_level4)]Please register for FREE REGISTER to read full post below containing analysis. In case of any error or you think you are not able to read the full post below, please email us at support#nehcap.com [lwa][/s2If] [s2If current_user_can(access_s2member_level1)]
- EUR/GBP bulls failed to defend the 20-day SMA, and the cross fell near 0.8555.
The pair currently trades last at 0.85564.
The previous day high was 0.8611 while the previous day low was 0.8584. The daily 38.2% Fib levels comes at 0.8594, expected to provide resistance. Similarly, the daily 61.8% fib level is at 0.8601, expected to provide resistance.
The daily chart suggests the EUR/GBP has a bearish technical bias for the short term, with technical indicators suggesting that the bears have taken the lead for the short term. The Euro traded weak against most of it rivals on Wednesday, which contributed to the cross failing to consolidate above the 20-day Simple Moving Average (SMA) of 0.8580.
The daily Relative Strength Index (RSI) also exhibits a southward slope below its midline, emphasising the presence of intense selling pressure. At the same time, the Moving Average Convergence Divergence (MACD), with its red bars, highlights the strengthening bearish momentum for the EUR/GBP. Similar signals are seen in the four-hour chart, with both indicators comfortably standing in negative territory.
On the bigger time frame, the pair is below the 20,100 and 200-day Simple Moving Averages (SMAs), suggesting that the buyers are struggling to overcome the overall bearish trend and the bears are still in charge.
Support levels: 0.8560, 0.8640, 0.8495.
Resistance levels: 0.8580 (20-day SMA), 0.8600, 0.8615.
Technical Levels: Supports and Resistances
EURGBP currently trading at 0.8556 at the time of writing. Pair opened at 0.8587 and is trading with a change of -0.36 % .
| Overview | Overview.1 | |
|---|---|---|
| 0 | Today last price | 0.8556 |
| 1 | Today Daily Change | -0.0031 |
| 2 | Today Daily Change % | -0.3600 |
| 3 | Today daily open | 0.8587 |
The pair remains strongly bearish on the daily time frame. It trades below the 20 SMA @ 0.8585, 50 SMA 0.8586, 100 SMA @ 0.8641 and 200 SMA @ 0.8714.
| Trends | Trends.1 | |
|---|---|---|
| 0 | Daily SMA20 | 0.8585 |
| 1 | Daily SMA50 | 0.8586 |
| 2 | Daily SMA100 | 0.8641 |
| 3 | Daily SMA200 | 0.8714 |
The previous day high was 0.8611 while the previous day low was 0.8584. The daily 38.2% Fib levels comes at 0.8594, expected to provide resistance. Similarly, the daily 61.8% fib level is at 0.8601, expected to provide resistance.
Note the levels of interest below:
- Pivot support is noted at 0.8577, 0.8568, 0.8551
- Pivot resistance is noted at 0.8604, 0.862, 0.863
| Levels | Levels.1 |
|---|---|
| Previous Daily High | 0.8611 |
| Previous Daily Low | 0.8584 |
| Previous Weekly High | 0.8586 |
| Previous Weekly Low | 0.8493 |
| Previous Monthly High | 0.8701 |
| Previous Monthly Low | 0.8504 |
| Daily Fibonacci 38.2% | 0.8594 |
| Daily Fibonacci 61.8% | 0.8601 |
| Daily Pivot Point S1 | 0.8577 |
| Daily Pivot Point S2 | 0.8568 |
| Daily Pivot Point S3 | 0.8551 |
| Daily Pivot Point R1 | 0.8604 |
| Daily Pivot Point R2 | 0.8620 |
| Daily Pivot Point R3 | 0.8630 |
[/s2If]
Download Nehcap EAWe have two EAs that are operational on our LIVE accounts.
- EA-FIX: Check out the details here. Download EA-FIX . EA-FIX is a non-grid HFT scalper.
- EA-GROWTH: High quality low dd EA using trend grids. Download EA_GROWTHJoin Our Telegram Group
")


