The AUDUSD pair is experiencing a rise, thanks to positive news about Australia’s Private Capital Expenditure.
…
This is a premium post.
[s2If !current_user_can(access_s2member_level4)]Please register for FREE REGISTER to read full post below containing analysis. In case of any error or you think you are not able to read the full post below, please email us at support#nehcap.com [lwa][/s2If] [s2If current_user_can(access_s2member_level1)]
- AUD/USD trades higher due to upbeat Australia’s Private Capital Expenditure.
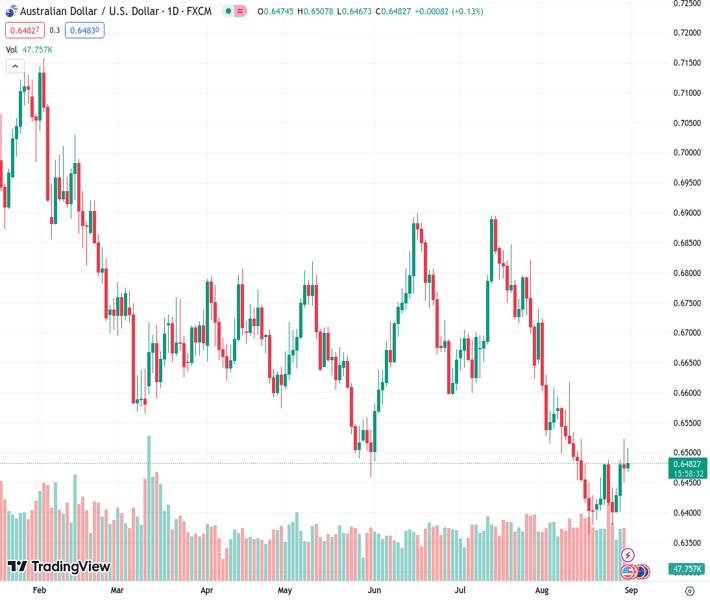
The pair currently trades last at 0.64826.
The previous day high was 0.6522 while the previous day low was 0.6449. The daily 38.2% Fib levels comes at 0.6477, expected to provide support. Similarly, the daily 61.8% fib level is at 0.6494, expected to provide resistance.
AUD/USD retraces from the previous day’s losses, trading higher around 0.6480 at the time of writing during the Asian session on Thursday. The pair is experiencing upward support due to the downbeat US Treasury yields and disappointing US economic data.
Additionally, Australia’s upbeat Private Capital Expenditure (Q2) was released on Thursday, contributing support to the AUD/USD pair. The data reported that capital expenditure intentions improved to 2.8%, better than the expected 1.2% figure and 2.4% prior.
The 23.6% Fibonacci retracement at 0.6488 emerges as the immediate resistance, followed by the 0.6500 psychological level. A firm break above the latter could support the AUD/USD pair to explore the area around a three-week high at 0.6522, followed by the 38.2% Fibonacci retracement at 0.6565.
On the downside, the pair could meet the key support around the 21-day Simple Moving Average (SMA) at 0.6474, followed by the nine-day SMA at 0.6445. A break below that level could put pressure on the AUD/USD pair to navigate the region around the 0.6400 psychological level.
The 14-day Relative Strength Index (RSI) remains below 50, which suggests a bearish bias of the AUD/USD traders. The Moving Average Convergence Divergence (MACD) line remains below the centerline; however, it indicates a divergence above the signal line. This divergence indicates an improvement in recent momentum.
In the short term, the underlying trend exhibits a bearish outlook as long as the AUD/USD pair stays below the 50-day EMA at 0.6610.
Technical Levels: Supports and Resistances
AUDUSD currently trading at 0.6482 at the time of writing. Pair opened at 0.6475 and is trading with a change of 0.11 % .
| Overview | Overview.1 | |
|---|---|---|
| 0 | Today last price | 0.6482 |
| 1 | Today Daily Change | 0.0007 |
| 2 | Today Daily Change % | 0.1100 |
| 3 | Today daily open | 0.6475 |
The pair is trading above its 20 Daily moving average @ 0.6474, below its 50 Daily moving average @ 0.6616 , below its 100 Daily moving average @ 0.6649 and below its 200 Daily moving average @ 0.6724
| Trends | Trends.1 | |
|---|---|---|
| 0 | Daily SMA20 | 0.6474 |
| 1 | Daily SMA50 | 0.6616 |
| 2 | Daily SMA100 | 0.6649 |
| 3 | Daily SMA200 | 0.6724 |
The previous day high was 0.6522 while the previous day low was 0.6449. The daily 38.2% Fib levels comes at 0.6477, expected to provide support. Similarly, the daily 61.8% fib level is at 0.6494, expected to provide resistance.
Note the levels of interest below:
- Pivot support is noted at 0.6442, 0.6409, 0.6369
- Pivot resistance is noted at 0.6515, 0.6555, 0.6588
| Levels | Levels.1 |
|---|---|
| Previous Daily High | 0.6522 |
| Previous Daily Low | 0.6449 |
| Previous Weekly High | 0.6488 |
| Previous Weekly Low | 0.6380 |
| Previous Monthly High | 0.6895 |
| Previous Monthly Low | 0.6599 |
| Daily Fibonacci 38.2% | 0.6477 |
| Daily Fibonacci 61.8% | 0.6494 |
| Daily Pivot Point S1 | 0.6442 |
| Daily Pivot Point S2 | 0.6409 |
| Daily Pivot Point S3 | 0.6369 |
| Daily Pivot Point R1 | 0.6515 |
| Daily Pivot Point R2 | 0.6555 |
| Daily Pivot Point R3 | 0.6588 |
[/s2If]
Download Nehcap EAWe have two EAs that are operational on our LIVE accounts.
- EA-FIX: Check out the details here. Download EA-FIX . EA-FIX is a non-grid HFT scalper.
- EA-GROWTH: High quality low dd EA using trend grids. Download EA_GROWTHJoin Our Telegram Group
")


