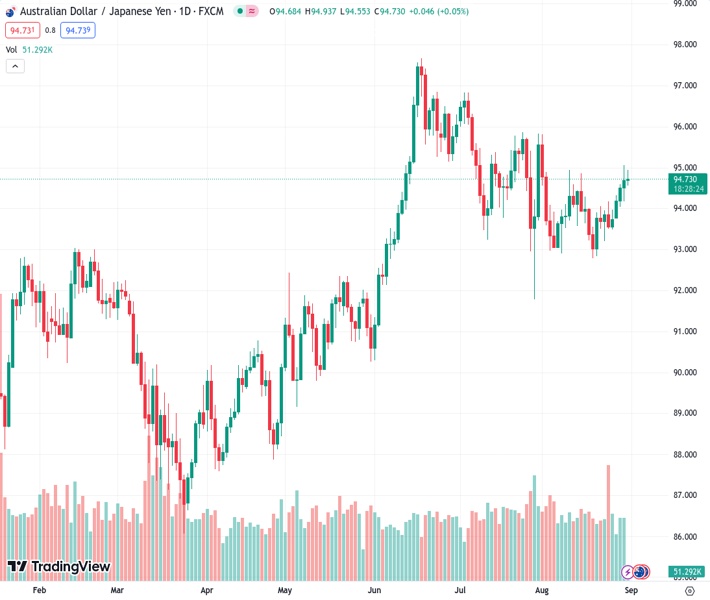
The AUDJPY pair has been trading in the positive zone for five consecutive days as of Thursday, with a value of 94.7270.
…
This is a premium post.
[s2If !current_user_can(access_s2member_level4)]Please register for FREE REGISTER to read full post below containing analysis. In case of any error or you think you are not able to read the full post below, please email us at support#nehcap.com [lwa][/s2If] [s2If current_user_can(access_s2member_level1)]
- AUD/JPY trades in positive territory for the fifth consecutive day on Thursday.
The pair currently trades last at 94.7270.
The previous day high was 95.06 while the previous day low was 94.17. The daily 38.2% Fib levels comes at 94.72, expected to provide support. Similarly, the daily 61.8% fib level is at 94.51, expected to provide support.
The AUD/JPY cross gains momentum above the mid-94.00s during the Asian trading hours on Thursday. The cross currently trades near 94.74, up 0.04% on the day. The monetary policy gap between the US and Japan is still the factor behind the yen’s weakness.
The Australian Bureau of Statistics revealed on Thursday that the nation’s Private Capital Expenditure for the second quarter rose 2.8% from 2.4% previous reading. The figure came in better than the expectation of 1.2%. Meanwhile, the Private Sector Credit MoM expanded by 0.3% against the previous month of 0.2% and matched the market consensus of 0.3%. The Aussie is firmer against the Japanese Yen despite the mixed Australian reading.
The latest data from Japan’s Ministry of Economy, Trade and Industry reported that Retail Sales rose by 6.8% YoY in July versus 5.6% prior, better than the expectation of 5.4%. On the other hand, Industrial Production dropped by 2.0% MoM in July from a rise of 2.4% in the previous month, compared to market consensus of a 1.4% drop.
The Bank of Japan (BoJ) Governor Kazuo Ueda stated at a Federal Reserve symposium on Saturday that the central bank considers underlying inflation remain below its target and will therefore maintain the current ultra-loose monetary policy framework. According to policymakers, domestic demand is still robust and corporate fixed-investment is fueled by record high profits. However, the monetary policy differential between the US and Japan is the main driver of the Yen’s weakening.
Looking ahead, the Australian S&P Global Manufacturing PMI for August and the Japanese Jibun Bank Manufacturing PMI will be released on Friday. Traders will take cues from these data and find trading opportunities around the AUD/JPY cross.
Technical Levels: Supports and Resistances
AUDJPY currently trading at 94.71 at the time of writing. Pair opened at 94.7 and is trading with a change of 0.01 % .
| Overview | Overview.1 | |
|---|---|---|
| 0 | Today last price | 94.71 |
| 1 | Today Daily Change | 0.01 |
| 2 | Today Daily Change % | 0.01 |
| 3 | Today daily open | 94.70 |
The pair remains strongly bullish on the daily timeframe. It trades above its 20 SMA @ 93.87, 50 SMA 94.67, 100 SMA @ 93.23 and 200 SMA @ 91.91.
| Trends | Trends.1 | |
|---|---|---|
| 0 | Daily SMA20 | 93.87 |
| 1 | Daily SMA50 | 94.67 |
| 2 | Daily SMA100 | 93.23 |
| 3 | Daily SMA200 | 91.91 |
The previous day high was 95.06 while the previous day low was 94.17. The daily 38.2% Fib levels comes at 94.72, expected to provide support. Similarly, the daily 61.8% fib level is at 94.51, expected to provide support.
Note the levels of interest below:
- Pivot support is noted at 94.22, 93.75, 93.33
- Pivot resistance is noted at 95.12, 95.54, 96.01
| Levels | Levels.1 |
|---|---|
| Previous Daily High | 95.06 |
| Previous Daily Low | 94.17 |
| Previous Weekly High | 94.18 |
| Previous Weekly Low | 92.83 |
| Previous Monthly High | 96.84 |
| Previous Monthly Low | 91.79 |
| Daily Fibonacci 38.2% | 94.72 |
| Daily Fibonacci 61.8% | 94.51 |
| Daily Pivot Point S1 | 94.22 |
| Daily Pivot Point S2 | 93.75 |
| Daily Pivot Point S3 | 93.33 |
| Daily Pivot Point R1 | 95.12 |
| Daily Pivot Point R2 | 95.54 |
| Daily Pivot Point R3 | 96.01 |
[/s2If]
Download Nehcap EAWe have two EAs that are operational on our LIVE accounts.
- EA-FIX: Check out the details here. Download EA-FIX . EA-FIX is a non-grid HFT scalper.
- EA-GROWTH: High quality low dd EA using trend grids. Download EA_GROWTHJoin Our Telegram Group
")


