On Thursday, the exchange rate of the US Dollar against the Japanese Yen at 146.063 faces resistance due to a newly emerged supply, and is negatively affected by a decline in the value of the US Dollar.
…
This is a premium post.
[s2If !current_user_can(access_s2member_level4)]Please register for FREE REGISTER to read full post below containing analysis. In case of any error or you think you are not able to read the full post below, please email us at support#nehcap.com [lwa][/s2If] [s2If current_user_can(access_s2member_level1)]
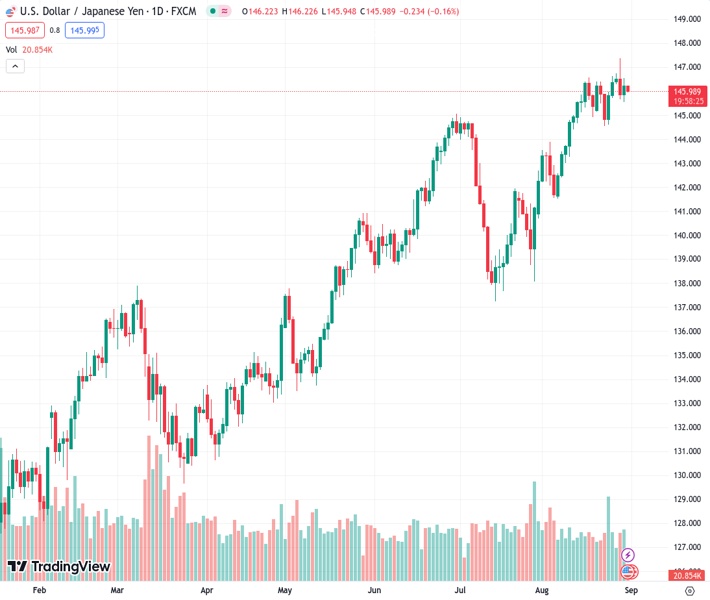
- USD/JPY meets with a fresh supply on Thursday and is weighed down by a weaker USD.
The pair currently trades last at 146.063.
The previous day high was 146.54 while the previous day low was 145.56. The daily 38.2% Fib levels comes at 146.16, expected to provide resistance. Similarly, the daily 61.8% fib level is at 145.93, expected to provide support.
The USD/JPY pair struggles to capitalize on the previous day’s bounce from the 145.55 area or the weekly low and comes under some renewed selling pressure during the Asian session on Thursday. Spot prices currently trade just above the 146.00 round figure, down over 0.10% for the day, and could slide further in the wake of a weaker tone surrounding the US Dollar (USD).
In fact, the USD Index (DXY), which tracks the Greenback against a basket of currencies, remains on the defensive near a two-week low touched in the aftermath of disappointing US macro data released on Wednesday. A report published by Automatic Data Processing (ADP) showed that Private sector employment in the US rose by 177K in August against the 195K anticipated and the previous month’s downwardly revised reading of 324K. Adding to this, the US 2 GDP growth was revised down to 2.1% annualized rate from the 2.4% estimated originallly and reainforced expectations that the Federal Reserve (Fed) will pause its rate-hiking cycle in September.
This, in turn, led to the overnight sharp fall in the US Treasury bond yields and continues to undermine the buck, which, in turn, is seen weighing on the USD/JPY pair. The markets, however, are still pricing in the possibility of one more 25 bps Fed rate hike move by the end of this year. In contrast, the BoJ is expected to stick to its ultra-lose monetary policy settings. This, in turn, might hold back traders from placing aggressive bearish bets around the major. It is worth recalling that BoJ Governor Kazuo Ueda had said last week that the underlying inflation in Japan remains a bit below the 2% target, ensuring that the central bank may keep the status quo until next summer.
Meanwhile, Japan’s Ministry of Economy, Trade and Industry reported that Industrial Production fell by 2.0% MoM in July as compared to market expectations a 1.4% decline and a 2.4% rise in the previous month. The disappointment, however, was largely offset by the better-than-expected release of Japanese Retail Sales data, which grew by 6.8% YoY rate in July, up from 5.6% previous. The data does little to provide any impetus to the USD/JPY pair as the market focus remains glued to the release of the US Core PCE Price Index – the Fed’s preferred inflation gauge – and the Weekly Initial Jobless Claims, due later during the early North American session.
Technical Levels: Supports and Resistances
USDJPY currently trading at 146.05 at the time of writing. Pair opened at 146.24 and is trading with a change of -0.13 % .
| Overview | Overview.1 | |
|---|---|---|
| 0 | Today last price | 146.05 |
| 1 | Today Daily Change | -0.19 |
| 2 | Today Daily Change % | -0.13 |
| 3 | Today daily open | 146.24 |
The pair remains strongly bullish on the daily timeframe. It trades above its 20 SMA @ 145.01, 50 SMA 143.13, 100 SMA @ 140.27 and 200 SMA @ 136.76.
| Trends | Trends.1 | |
|---|---|---|
| 0 | Daily SMA20 | 145.01 |
| 1 | Daily SMA50 | 143.13 |
| 2 | Daily SMA100 | 140.27 |
| 3 | Daily SMA200 | 136.76 |
The previous day high was 146.54 while the previous day low was 145.56. The daily 38.2% Fib levels comes at 146.16, expected to provide resistance. Similarly, the daily 61.8% fib level is at 145.93, expected to provide support.
Note the levels of interest below:
- Pivot support is noted at 145.69, 145.13, 144.71
- Pivot resistance is noted at 146.67, 147.09, 147.65
| Levels | Levels.1 |
|---|---|
| Previous Daily High | 146.54 |
| Previous Daily Low | 145.56 |
| Previous Weekly High | 146.64 |
| Previous Weekly Low | 144.54 |
| Previous Monthly High | 144.91 |
| Previous Monthly Low | 137.24 |
| Daily Fibonacci 38.2% | 146.16 |
| Daily Fibonacci 61.8% | 145.93 |
| Daily Pivot Point S1 | 145.69 |
| Daily Pivot Point S2 | 145.13 |
| Daily Pivot Point S3 | 144.71 |
| Daily Pivot Point R1 | 146.67 |
| Daily Pivot Point R2 | 147.09 |
| Daily Pivot Point R3 | 147.65 |
[/s2If]
Download Nehcap EAWe have two EAs that are operational on our LIVE accounts.
- EA-FIX: Check out the details here. Download EA-FIX . EA-FIX is a non-grid HFT scalper.
- EA-GROWTH: High quality low dd EA using trend grids. Download EA_GROWTHJoin Our Telegram Group
")


