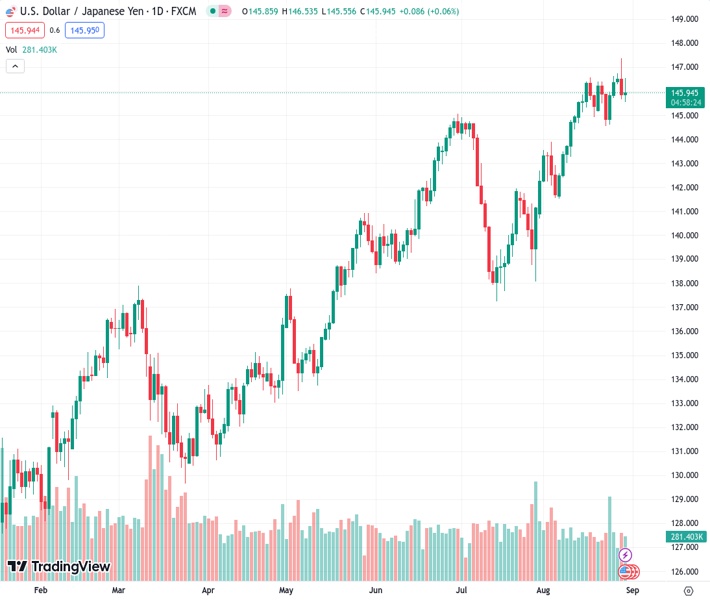
The USDJPY pair, currently at a rate of 145.972, has experienced a 0.13% decrease and is now trading at 145.68. This decline can be attributed to underwhelming US employment figures and a Q2 GDP growth rate that fell short of expectations.
…
This is a premium post.
[s2If !current_user_can(access_s2member_level4)]Please register for FREE REGISTER to read full post below containing analysis. In case of any error or you think you are not able to read the full post below, please email us at support#nehcap.com [lwa][/s2If] [s2If current_user_can(access_s2member_level1)]
- USD/JPY trades down 0.13% at 145.68, pressured by disappointing US labor market data and lower-than-expected Q2 GDP growth.
The pair currently trades last at 145.972.
The previous day high was 147.38 while the previous day low was 145.67. The daily 38.2% Fib levels comes at 146.32, expected to provide resistance. Similarly, the daily 61.8% fib level is at 146.72, expected to provide resistance.
The Japanese Yen (JPY) registers back-to-back positive sessions against the US Dollar (USD), which remains downward pressured after last Tuesday’s data depicted the US labor market is cooling. Today’s data reinforced the latter, easing pressure on the US central bank to increase borrowing costs. The USD/JPY is trading at 145.68, down 0.13%, after reaching a daily high of 146.84.
The Greenback extended its losses courtesy of weaker-than-expected growth data. The US Commerce Department Q2’s Gross Domestic Product (GDP) was 2.1% below the government’s previous estimates of 2.4%, an uptick from Q1’s 2%. That, alongside the ADP National Employment report missing estimates of 195K at 177K, revealed the labor market is losing steam.
On Tuesday, the US Department of Labor revealed 1.51 job openings for every unemployed person, the lowest ratio since September 2021, compared with 1.54 in June.
Given the worse-than-expected economic data, US Treasury bond yields fell. The US 10-year Treasury Note yield slides two basis points down to 4.102%, a headwind for the USD/JPY pair due to its close positive correlation. That undermined the US Dollar (USD), which, according to its index, the US Dollar Index (DXY) slumps 0.43%, down at 103.041.
On the Japanese front, the Bank of Japan (BoJ) board member Naoki Tamura said that inflation is “clearly in sight,” indicating that negative rates could end next year. Market participants are eyeing the BoJ’s next move, as it’s the only global central bank easing monetary policy. Once the BoJ normalizes its monetary policy, broad Japanese Yen (JPY) strength is expected. It could trim its 11.22% YTD losses against the Greenback, suggesting further USD/JPY downside is expected.
From a technical perspective, the USD/JPY remains upward biased, though the pair slide below the Tenkan-Sen line at 145.95 could open the door for a pullback, with support emerging at the June 30 daily high turned support at 145.07. Otherwise, if buyers reclaim the Tenkan-Sen line, the next stop would be 146.00. A breach of the latter could pave the way for a test of the year-to-date (YTD) high of 147.37.
Technical Levels: Supports and Resistances
USDJPY currently trading at 145.81 at the time of writing. Pair opened at 145.88 and is trading with a change of -0.05 % .
| Overview | Overview.1 | |
|---|---|---|
| 0 | Today last price | 145.81 |
| 1 | Today Daily Change | -0.07 |
| 2 | Today Daily Change % | -0.05 |
| 3 | Today daily open | 145.88 |
The pair remains strongly bullish on the daily timeframe. It trades above its 20 SMA @ 144.87, 50 SMA 143.04, 100 SMA @ 140.14 and 200 SMA @ 136.73.
| Trends | Trends.1 | |
|---|---|---|
| 0 | Daily SMA20 | 144.87 |
| 1 | Daily SMA50 | 143.04 |
| 2 | Daily SMA100 | 140.14 |
| 3 | Daily SMA200 | 136.73 |
The previous day high was 147.38 while the previous day low was 145.67. The daily 38.2% Fib levels comes at 146.32, expected to provide resistance. Similarly, the daily 61.8% fib level is at 146.72, expected to provide resistance.
Note the levels of interest below:
- Pivot support is noted at 145.24, 144.6, 143.53
- Pivot resistance is noted at 146.95, 148.02, 148.66
| Levels | Levels.1 |
|---|---|
| Previous Daily High | 147.38 |
| Previous Daily Low | 145.67 |
| Previous Weekly High | 146.64 |
| Previous Weekly Low | 144.54 |
| Previous Monthly High | 144.91 |
| Previous Monthly Low | 137.24 |
| Daily Fibonacci 38.2% | 146.32 |
| Daily Fibonacci 61.8% | 146.72 |
| Daily Pivot Point S1 | 145.24 |
| Daily Pivot Point S2 | 144.60 |
| Daily Pivot Point S3 | 143.53 |
| Daily Pivot Point R1 | 146.95 |
| Daily Pivot Point R2 | 148.02 |
| Daily Pivot Point R3 | 148.66 |
[/s2If]
Download Nehcap EAWe have two EAs that are operational on our LIVE accounts.
- EA-FIX: Check out the details here. Download EA-FIX . EA-FIX is a non-grid HFT scalper.
- EA-GROWTH: High quality low dd EA using trend grids. Download EA_GROWTHJoin Our Telegram Group
")


