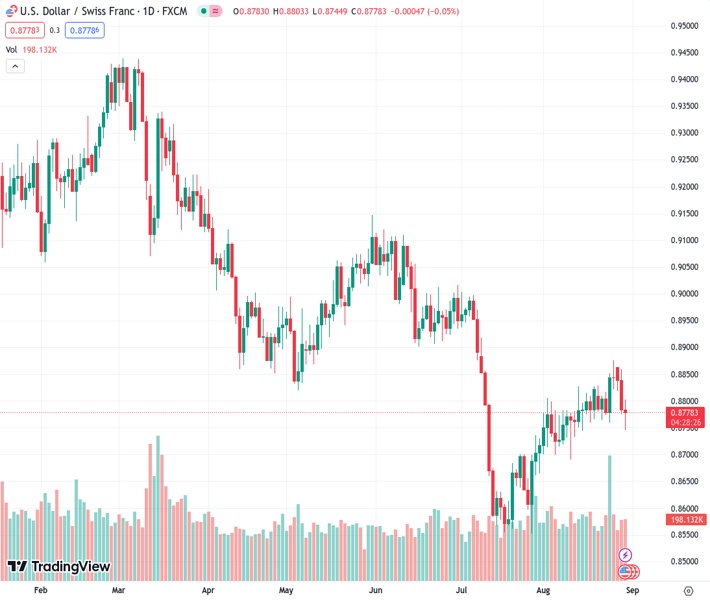
The USDCHF pair, currently at 0.87778, saw a decline to 0.8775, falling below the 20-day simple moving average of 0.8780.
…
This is a premium post.
[s2If !current_user_can(access_s2member_level4)]Please register for FREE REGISTER to read full post below containing analysis. In case of any error or you think you are not able to read the full post below, please email us at support#nehcap.com [lwa][/s2If] [s2If current_user_can(access_s2member_level1)]
- USD/CHF dropped to 0.8775, below the 20-day SMA of 0.8780.
The pair currently trades last at 0.87778.
The previous day high was 0.8859 while the previous day low was 0.8775. The daily 38.2% Fib levels comes at 0.8807, expected to provide resistance. Similarly, the daily 61.8% fib level is at 0.8827, expected to provide resistance.
In Wednesday’s session, the USD is trading weak against most of its rivals, driven by the report of weak economic figures. The Greenback had gained momentum against its rivals as its economy was resilient during the Federal Reserve (Fed) tightening cycle. Still, the report of soft economic figures warns investors that the lags of monetary policy may be kicking in. On the Swiss side, ZEW reported soft expectations figures from August.
The August survey from Automatic Data Processing (ADP), which gauges employment creation, indicated the generation of 177,000 jobs in the US. This figure fell short of the anticipated 195,000 and significantly declined from 371,000. Moreover, the second-quarter YoY Gross Domestic Product (GDP) underwent a downward revision, settling at 2.1%.
Reacting to the data, the USD, measured by the DXY index, dropped to 103.05, below its 200 and 20-day Simple Moving Averages, while the US Treasury yields continued to decrease and fell to their lowest in three weeks. In line with that, the markets continue to price in high odds of at least one more hike by the Federal Reserve (Fed) within this cycle, but the rate cut expectations have now been pushed to June 2024 from July.
Focus now shifts to Core Personal Consumption Expenditures (PCE) from July on Thursday, an essential gauge for inflation for the Fed. On Friday, markets will get the August Nonfarm Payrolls (NFP).
On the CHF side, the ZEW Survey of Expectation from August dropped higher than expected to -38.6 vs. the -31.3 expected, limiting the Swiss currency upside.
As per the daily chart analysis, the USD/CHF has a bearish technical bias for the short term, with both the Relative Strength Index (RSI) and Moving Average Convergence Divergence (MACD) residing in negative territory. The RSI also exhibits a southward slope below its midline, emphasising the presence of intense selling pressure. At the same time, the MACD, with its red bars, highlights the strengthening bearish momentum for the USD/CHF. Moreover, the pair is below the 20,100 and 200-day Simple Moving Averages (SMAs), pointing towards the prevailing strength of the bears in the larger context and the buyers facing a challenging situation.
Support levels: 0.8750, 0.8730, 0.8700.
Resistance levels: 0.8782 (20-day SMA), 0.8800, 0.8890 (100-day SMA).
Technical Levels: Supports and Resistances
USDCHF currently trading at 0.8775 at the time of writing. Pair opened at 0.8784 and is trading with a change of -0.1 % .
| Overview | Overview.1 | |
|---|---|---|
| 0 | Today last price | 0.8775 |
| 1 | Today Daily Change | -0.0009 |
| 2 | Today Daily Change % | -0.1000 |
| 3 | Today daily open | 0.8784 |
The pair remains strongly bearish on the daily time frame. It trades below the 20 SMA @ 0.8785, 50 SMA 0.8791, 100 SMA @ 0.8885 and 200 SMA @ 0.9076.
| Trends | Trends.1 | |
|---|---|---|
| 0 | Daily SMA20 | 0.8785 |
| 1 | Daily SMA50 | 0.8791 |
| 2 | Daily SMA100 | 0.8885 |
| 3 | Daily SMA200 | 0.9076 |
The previous day high was 0.8859 while the previous day low was 0.8775. The daily 38.2% Fib levels comes at 0.8807, expected to provide resistance. Similarly, the daily 61.8% fib level is at 0.8827, expected to provide resistance.
Note the levels of interest below:
- Pivot support is noted at 0.8753, 0.8722, 0.8669
- Pivot resistance is noted at 0.8837, 0.889, 0.8921
| Levels | Levels.1 |
|---|---|
| Previous Daily High | 0.8859 |
| Previous Daily Low | 0.8775 |
| Previous Weekly High | 0.8876 |
| Previous Weekly Low | 0.8760 |
| Previous Monthly High | 0.9005 |
| Previous Monthly Low | 0.8552 |
| Daily Fibonacci 38.2% | 0.8807 |
| Daily Fibonacci 61.8% | 0.8827 |
| Daily Pivot Point S1 | 0.8753 |
| Daily Pivot Point S2 | 0.8722 |
| Daily Pivot Point S3 | 0.8669 |
| Daily Pivot Point R1 | 0.8837 |
| Daily Pivot Point R2 | 0.8890 |
| Daily Pivot Point R3 | 0.8921 |
[/s2If]
Download Nehcap EAWe have two EAs that are operational on our LIVE accounts.
- EA-FIX: Check out the details here. Download EA-FIX . EA-FIX is a non-grid HFT scalper.
- EA-GROWTH: High quality low dd EA using trend grids. Download EA_GROWTHJoin Our Telegram Group
")


