The US dollar to Mexican peso exchange rate of 16.7652 has decreased as a result of the cautious attitude surrounding the Federal Reserve’s monetary policy.
…
This is a premium post.
[s2If !current_user_can(access_s2member_level4)]Please register for FREE REGISTER to read full post below containing analysis. In case of any error or you think you are not able to read the full post below, please email us at support#nehcap.com [lwa][/s2If] [s2If current_user_can(access_s2member_level1)]
- USD/MXN trades lower due to the dovish sentiment around Fed policy.
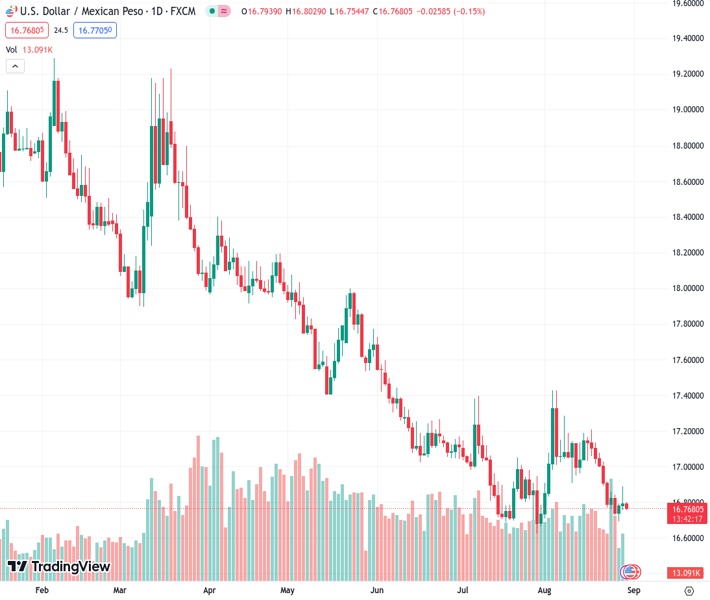
The pair currently trades last at 16.7652.
The previous day high was 16.8888 while the previous day low was 16.7552. The daily 38.2% Fib levels comes at 16.8378, expected to provide resistance. Similarly, the daily 61.8% fib level is at 16.8062, expected to provide resistance.
USD/MXN snaps two-day winning streak, trading lower around 16.80 during the Asian session on Wednesday, possibly due to the dovish sentiment surrounding the monetary policy decision by the US Federal Reserve (Fed), which could be attributed to the United States (US) downbeat economic data on Tuesday.
US Consumer Confidence declined to 106.1 in August from 114.0 prior, compared to the expected 116.0. US JOLTS Job Openings reduced to 8.827 million in July against the previous 9.165 million. This contrasted with the expected rise to 9.465 million.
However, the USD/MXN pair experienced strength due to Mexico’s downbeat Gross Domestic Product (GDP) (YoY) for the second quarter on Tuesday. The report printed 3.6%, falling short of the expected to remain consistent at 3.7%. While, GDP (QoQ) declined to 0.8% from the previous 1.0%, against expectations of 0.9%.
The US Dollar Index (DXY), which measures the performance of the US Dollar (USD) against the six other major currencies, trades higher around 103.60. This upward movement could be attributed to the recovery in US Treasury yields after a decline of 2.77% in the previous two days. Currently, the yield on 10-year US trades at 4.14% by the press time.
According to the CME’s FedWatch Tool, the current market assessment suggests an 11.5% probability of a rate hike in the upcoming meeting by the Federal Reserve. Investors project that the Fed is more inclined to postpone any rate increases until its meeting in September. This prevailing sentiment is contributing to a weakening of the safe-haven Greenback.
Investors will closely monitor the forthcoming US economic data to gain a more lucid understanding of the economic trajectory of the United States (US). This focus is spurred by Fed Chairman Jerome Powell’s remarks at the Jackson Hole Symposium, indicating that any future interest rate hikes will be determined based on data-driven analysis.
Wednesday’s top-tier macroeconomic docket includes the US ADP Employment Change for August and the preliminary Gross Domestic Product Annualized for the second quarter (Q2). These datasets will help in shaping strategies before making fresh bets on the USD/MXN pair.
Technical Levels: Supports and Resistances
USDMXN currently trading at 16.7675 at the time of writing. Pair opened at 16.795 and is trading with a change of -0.16 % .
| Overview | Overview.1 | |
|---|---|---|
| 0 | Today last price | 16.7675 |
| 1 | Today Daily Change | -0.0275 |
| 2 | Today Daily Change % | -0.1600 |
| 3 | Today daily open | 16.7950 |
The pair remains strongly bearish on the daily time frame. It trades below the 20 SMA @ 17.0106, 50 SMA 16.9841, 100 SMA @ 17.3371 and 200 SMA @ 18.1007.
| Trends | Trends.1 | |
|---|---|---|
| 0 | Daily SMA20 | 17.0106 |
| 1 | Daily SMA50 | 16.9841 |
| 2 | Daily SMA100 | 17.3371 |
| 3 | Daily SMA200 | 18.1007 |
The previous day high was 16.8888 while the previous day low was 16.7552. The daily 38.2% Fib levels comes at 16.8378, expected to provide resistance. Similarly, the daily 61.8% fib level is at 16.8062, expected to provide resistance.
Note the levels of interest below:
- Pivot support is noted at 16.7371, 16.6793, 16.6035
- Pivot resistance is noted at 16.8708, 16.9466, 17.0045
| Levels | Levels.1 |
|---|---|
| Previous Daily High | 16.8888 |
| Previous Daily Low | 16.7552 |
| Previous Weekly High | 17.0800 |
| Previous Weekly Low | 16.7366 |
| Previous Monthly High | 17.3957 |
| Previous Monthly Low | 16.6258 |
| Daily Fibonacci 38.2% | 16.8378 |
| Daily Fibonacci 61.8% | 16.8062 |
| Daily Pivot Point S1 | 16.7371 |
| Daily Pivot Point S2 | 16.6793 |
| Daily Pivot Point S3 | 16.6035 |
| Daily Pivot Point R1 | 16.8708 |
| Daily Pivot Point R2 | 16.9466 |
| Daily Pivot Point R3 | 17.0045 |
[/s2If]
Download Nehcap EAWe have two EAs that are operational on our LIVE accounts.
- EA-FIX: Check out the details here. Download EA-FIX . EA-FIX is a non-grid HFT scalper.
- EA-GROWTH: High quality low dd EA using trend grids. Download EA_GROWTHJoin Our Telegram Group
")


