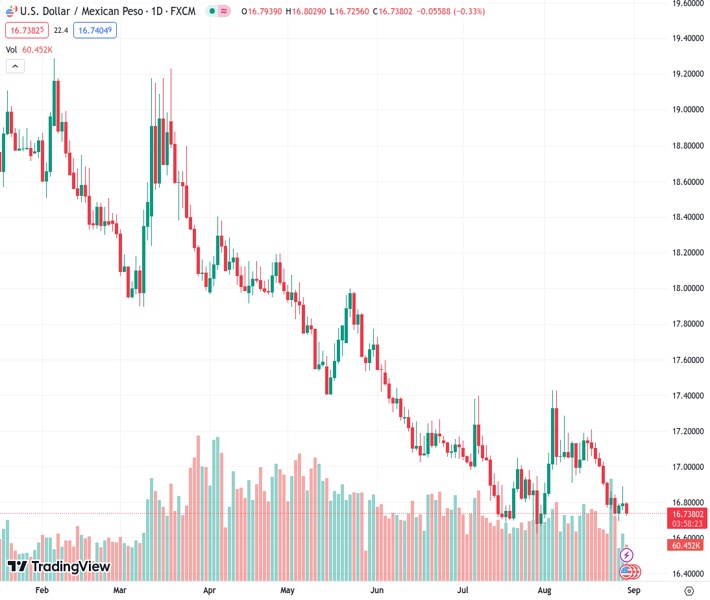
The US dollar to Mexican peso exchange rate, currently at 16.7356, is now trading at 16.7508, showing a decrease of 0.26%. This is a result of the disappointing labor and GDP data in the US, which is weakening the US dollar and causing a decline in US Treasury yields.
…
This is a premium post.
[s2If !current_user_can(access_s2member_level4)]Please register for FREE REGISTER to read full post below containing analysis. In case of any error or you think you are not able to read the full post below, please email us at support#nehcap.com [lwa][/s2If] [s2If current_user_can(access_s2member_level1)]
- USD/MXN trades at 16.7508, down 0.26%, as disappointing US labor and GDP data weaken the Greenback, pushing US Treasury yields lower.
The pair currently trades last at 16.7356.
The previous day high was 16.8888 while the previous day low was 16.7552. The daily 38.2% Fib levels comes at 16.8378, expected to provide resistance. Similarly, the daily 61.8% fib level is at 16.8062, expected to provide resistance.
The Mexican Peso (MXN) strengthened against the US Dollar (USD) on Wednesday after data from the United States (US) that the economy is decaying, according to the latest jobs and growth data. Hence, US Treasury bond yields dropped, a headwind for the Greenback. The USD/MXN is trading at 16.7508, losing 0.26% after hitting a high of 16.8029.
An upbeat market sentiment boosts appetite for the emerging market currency, as reflected by US equities rising. The Greenback is on the back foot after the US Commerce Department downward revised Q2 Gross Domestic Product (GDP) from 2.4% to 2.1%. Although figures exceed the first quarter data, the economy is stagnating, as the current week’s labor market data had shown.
In regards to that, private hiring slowed down, as announced by ADP on its National Employment report, which reported private companies added just 177K jobs, below estimates of 195K. That, alongside a weaker weekly job openings report, paints a not-so-good scenario for Friday’s US Nonfarm Payrolls report.
US Treasury bond yields fell and weighed on the Greenback in reaction to the data. The US Dollar Index (DXY), a measure of the buck’s value against a basket of six currencies, plunged more than 1% at 103.133. Hence, the USD/MXN extended its losses amid overall USD weakness.
Across the border, Jose Perez, the head of Emerging Markets Research at S&P Global, said he does not expect significant changes in Mexico’s credit profile in 2024. Perez added he expects Mexico’s monetary policy to remain stable, and rates could begin to ease in early 2024.
That said, given the Bank of Mexico (Banxico) forward guidance of higher for longer, the USD/MXN outlook is likely to remain downward biased, but the lack of a more robust catalyst keeps the pair above the YTD low of 16.6238.
From a technical standpoint, the USD/MXN has consolidated at around 16.6900/16.8900 during the week, as the 50 and 20-day Moving Average (DMA) shifted flat at 16.9694 and 16.9886, respectively, suggesting the pair is awaiting a fresh catalyst. Downside risks emerge at the weekly low of 16.6923, exposing the year-to-date (‘YTD) low of 16.6238. Otherwise, if the USD/MXN exceeds the weekly high, the 50-DMA at 16.9694 would be up for grabs.
Technical Levels: Supports and Resistances
USDMXN currently trading at 16.7477 at the time of writing. Pair opened at 16.795 and is trading with a change of -0.28 % .
| Overview | Overview.1 | |
|---|---|---|
| 0 | Today last price | 16.7477 |
| 1 | Today Daily Change | -0.0473 |
| 2 | Today Daily Change % | -0.2800 |
| 3 | Today daily open | 16.7950 |
The pair remains strongly bearish on the daily time frame. It trades below the 20 SMA @ 17.0106, 50 SMA 16.9841, 100 SMA @ 17.3371 and 200 SMA @ 18.1007.
| Trends | Trends.1 | |
|---|---|---|
| 0 | Daily SMA20 | 17.0106 |
| 1 | Daily SMA50 | 16.9841 |
| 2 | Daily SMA100 | 17.3371 |
| 3 | Daily SMA200 | 18.1007 |
The previous day high was 16.8888 while the previous day low was 16.7552. The daily 38.2% Fib levels comes at 16.8378, expected to provide resistance. Similarly, the daily 61.8% fib level is at 16.8062, expected to provide resistance.
Note the levels of interest below:
- Pivot support is noted at 16.7371, 16.6793, 16.6035
- Pivot resistance is noted at 16.8708, 16.9466, 17.0045
| Levels | Levels.1 |
|---|---|
| Previous Daily High | 16.8888 |
| Previous Daily Low | 16.7552 |
| Previous Weekly High | 17.0800 |
| Previous Weekly Low | 16.7366 |
| Previous Monthly High | 17.3957 |
| Previous Monthly Low | 16.6258 |
| Daily Fibonacci 38.2% | 16.8378 |
| Daily Fibonacci 61.8% | 16.8062 |
| Daily Pivot Point S1 | 16.7371 |
| Daily Pivot Point S2 | 16.6793 |
| Daily Pivot Point S3 | 16.6035 |
| Daily Pivot Point R1 | 16.8708 |
| Daily Pivot Point R2 | 16.9466 |
| Daily Pivot Point R3 | 17.0045 |
[/s2If]
Download Nehcap EAWe have two EAs that are operational on our LIVE accounts.
- EA-FIX: Check out the details here. Download EA-FIX . EA-FIX is a non-grid HFT scalper.
- EA-GROWTH: High quality low dd EA using trend grids. Download EA_GROWTHJoin Our Telegram Group
")


