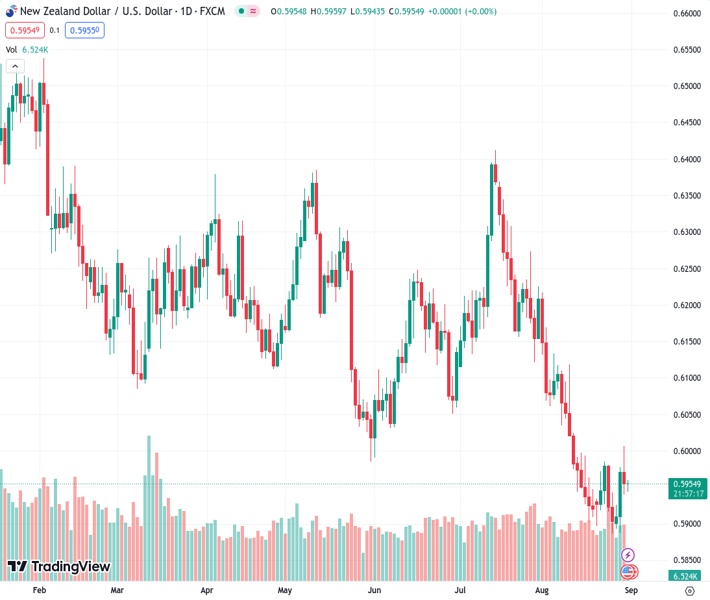
The NZDUSD pair remains under pressure after bouncing down from its highest point in three weeks.
…
This is a premium post.
[s2If !current_user_can(access_s2member_level4)]Please register for FREE REGISTER to read full post below containing analysis. In case of any error or you think you are not able to read the full post below, please email us at support#nehcap.com [lwa][/s2If] [s2If current_user_can(access_s2member_level1)]
- NZD/USD stays pressured after reversing from three-week high.
The pair currently trades last at 0.59537.
The previous day high was 0.5979 while the previous day low was 0.5887. The daily 38.2% Fib levels comes at 0.5944, expected to provide support. Similarly, the daily 61.8% fib level is at 0.5922, expected to provide support.
NZD/USD bucks the overall trend of cheering the US Dollar weakness by extending the previous day’s reversal from a three-week high to 0.5950 during early Asian session on Thursday. In doing so, the Kiwi pair justifies downbeat data at home and mixed concerns about a major customer China amid cautious mood ahead of the Fed’s preferred inflation gauge. It’s worth noting that the failure to cross May’s low during the early-week rebound also favored sellers of the Antipodeans.
A stark fall in New Zealand (NZ) Building Permits joins the Reserve Bank of New Zealand’s (RBNZ) status quo to weigh on the NZD/USD pair the previous day. That said, the NZ Building Permits for July marked a notable slump of 5.2% MoM versus 0.2% expected and 3.4% prior (revised from 3.5%).
On the other hand, China’s reaction to the US allegations that “it’s being risky for businesses” challenged the previous hopes of a smooth running of the Sino-American talks in Beijing. However, a slew of Chinese banks reduced mortgage rates and favored the hopes of witnessing more stimulus from the Asian major, which in turn repaired the damages to sentiment outside New Zealand.
Elsewhere, softer prints of the US statistics bolstered the call of Federal Reserve’s (Fed) policy pivot and weighed on the US Dollar, as well as the Treasury bond yields. That said, the second readings of the US second quarter (Q2) Gross Domestic Product (GDP) Annualized declined to 2.1% from 2.4% initial forecasts while the GDP Price Index also eased to 2.0% versus the first readings of 2.2%. Further, the preliminary readings of the Personal Consumption Expenditures (PCE) Prices also edged lower to 2.5% from 2.6% prior estimations for the said period. More importantly, the ADP Employment Change dropped to 177K compared to 195K market forecasts and 371K previous readings (revised from 324K).
Amid these plays, the US Dollar Index (DXY) dropped for the three consecutive days to the lowest level in two weeks, making rounds to 103.15-10 of late. That said, the benchmark US 10-year Treasury bond yields remain pressured at the lowest levels in three weeks, around 4.11% by the press time.
Moving on, New Zealand’s ANZ Activity Outlook and Business Confidence survey details for August will join China’s official NBS Manufacturing PMI and Non-Manufacturing PMI for the said month to entertain the NZD/USD traders. However, major attention will be given to the Fed’s preferred inflation gauge, namely the US Core PCE Price Index for August, for clear directions amid dovish calls about the US central bank.
Failure to cross May’s low of 0.5985 during the early-week rebound from the yearly bottom surrounding 0.5885 keeps the NZD/USD bears hopeful even as the oversold RSI offers a bumpy road to the Kiwi sellers.
Technical Levels: Supports and Resistances
NZDUSD currently trading at 0.5947 at the time of writing. Pair opened at 0.5972 and is trading with a change of -0.42% % .
| Overview | Overview.1 | |
|---|---|---|
| 0 | Today last price | 0.5947 |
| 1 | Today Daily Change | -0.0025 |
| 2 | Today Daily Change % | -0.42% |
| 3 | Today daily open | 0.5972 |
The pair remains strongly bearish on the daily time frame. It trades below the 20 SMA @ 0.5987, 50 SMA 0.6115, 100 SMA @ 0.6146 and 200 SMA @ 0.6225.
| Trends | Trends.1 | |
|---|---|---|
| 0 | Daily SMA20 | 0.5987 |
| 1 | Daily SMA50 | 0.6115 |
| 2 | Daily SMA100 | 0.6146 |
| 3 | Daily SMA200 | 0.6225 |
The previous day high was 0.5979 while the previous day low was 0.5887. The daily 38.2% Fib levels comes at 0.5944, expected to provide support. Similarly, the daily 61.8% fib level is at 0.5922, expected to provide support.
Note the levels of interest below:
- Pivot support is noted at 0.5913, 0.5854, 0.5821
- Pivot resistance is noted at 0.6005, 0.6038, 0.6097
| Levels | Levels.1 |
|---|---|
| Previous Daily High | 0.5979 |
| Previous Daily Low | 0.5887 |
| Previous Weekly High | 0.5987 |
| Previous Weekly Low | 0.5885 |
| Previous Monthly High | 0.6413 |
| Previous Monthly Low | 0.6120 |
| Daily Fibonacci 38.2% | 0.5944 |
| Daily Fibonacci 61.8% | 0.5922 |
| Daily Pivot Point S1 | 0.5913 |
| Daily Pivot Point S2 | 0.5854 |
| Daily Pivot Point S3 | 0.5821 |
| Daily Pivot Point R1 | 0.6005 |
| Daily Pivot Point R2 | 0.6038 |
| Daily Pivot Point R3 | 0.6097 |
[/s2If]
Download Nehcap EAWe have two EAs that are operational on our LIVE accounts.
- EA-FIX: Check out the details here. Download EA-FIX . EA-FIX is a non-grid HFT scalper.
- EA-GROWTH: High quality low dd EA using trend grids. Download EA_GROWTHJoin Our Telegram Group
")


